
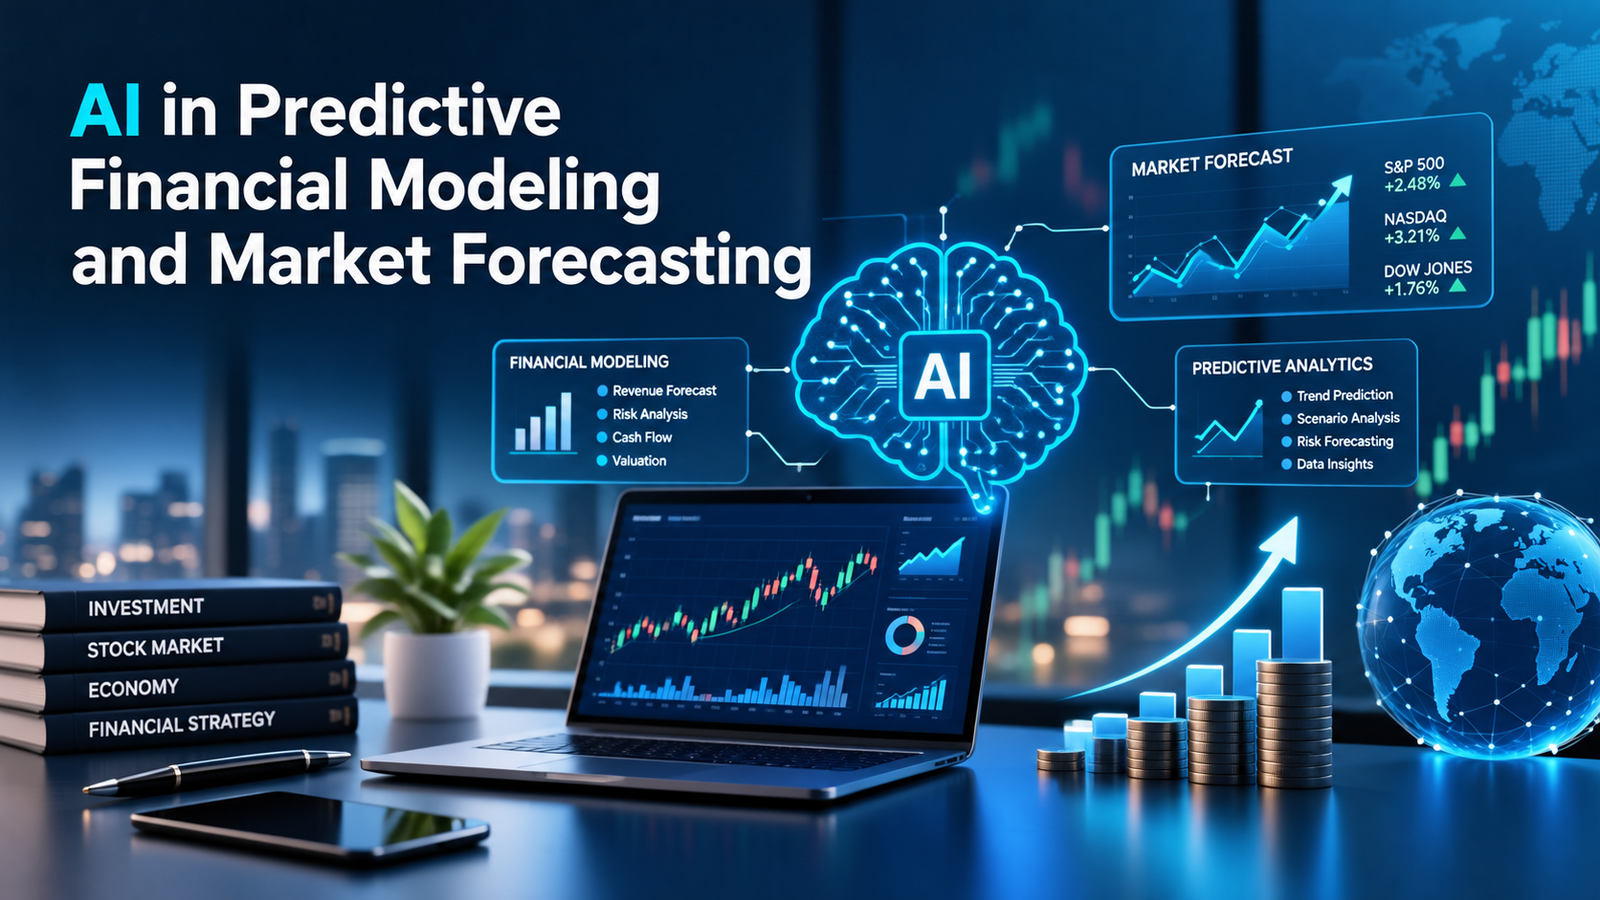
Primary topic: AI in Predictive Financial Modeling and Market Forecasting
Research focus: Machine learning for financial forecasting, predictive financial models, stock and asset-price prediction, volatility forecasting, macroeconomic indicators, market-regime detection, alternative data, deep learning, financial time-series analysis, risk forecasting, portfolio decisions and AI model governance
What Is AI in Predictive Financial Modeling?
Predictive financial modeling uses historical and current information to estimate future financial outcomes. These outcomes may include asset prices, revenue, earnings, interest rates, credit losses, market volatility, liquidity requirements, cash flows or broader economic conditions. AI strengthens this process by learning relationships from data and updating forecasts as new information becomes available.
Traditional financial models remain essential. Econometric methods such as autoregressive models, generalized autoregressive conditional heteroskedasticity models, vector autoregression and regime-switching models provide established ways to describe time-series behavior. Machine learning adds techniques such as gradient-boosted trees, random forests, support vector regression, recurrent neural networks, Transformers and ensemble models.
The most useful architecture often combines these approaches. A statistical model can capture persistence and established economic relationships, while an AI model identifies nonlinear patterns or interactions across a wider set of predictors. The resulting forecast can then be compared with a simple benchmark before it is used in a financial decision.
Prices, fundamentals, rates, news
Signals, lags, regimes
Statistical + AI
Risk, planning, allocation
The forecast is an input to a decision process, not a guarantee of a future outcome.
Why Financial Forecasting Needs a Different AI Approach
Financial data behaves differently from many datasets used in ordinary business prediction. Customer demand may follow recurring seasonal patterns, but financial markets respond to new information, changing expectations, policy decisions, liquidity conditions and the actions of other market participants. A relationship learned from one period can weaken or reverse in another.
This creates several challenges for model developers.
- Non-stationarity: Relationships between variables can change as market structure, policy and investor behavior evolve
- Low signal-to-noise ratio: Short-term price movements contain substantial randomness, making persistent predictive signals difficult to isolate
- Structural breaks: Crises, rate changes, geopolitical events and new regulations can make historical patterns less relevant
- Data leakage: A model can appear accurate if information unavailable at the forecast date accidentally enters training or testing
- Economic friction: A forecast can be statistically accurate but still fail to produce value after transaction costs, slippage, financing costs and execution constraints
- Uncertainty: A point estimate does not show how wide the range of plausible outcomes may be
These issues explain why an AI forecasting project needs more than model training. Data design, validation, benchmark selection, uncertainty estimation and ongoing monitoring are equally important.
Research Study: Machine Learning in Stock Market Forecasting, 2026
A comprehensive review published in Discover Computing on September 3, 2026, examined machine learning and deep learning research across equities, indices, commodities, foreign exchange and cryptocurrency markets. It covered classical machine learning, recurrent neural networks, convolutional models, attention mechanisms, Transformers, multimodal systems, graph-based approaches and reinforcement learning.
The review included 103 studies in its qualitative synthesis. A more focused quantitative analysis examined 17 peer-reviewed studies containing 47 comparisons between proposed models and baselines evaluated on the same dataset and forecast horizon.
Across those directly comparable error-based comparisons, the study-level median relative error reduction was 20.3%. The interquartile range was 5.7% to 50.7%, while the full range extended from a 0.8% deterioration to a 71.5% reduction. These results suggest that AI frequently improved forecasting errors in the selected experiments, but the range also shows that improvements were not universal.
The review emphasized differences in forecast targets, time horizons, data frequencies, validation methods and performance metrics. It also warned that transaction costs, slippage, changing market regimes and inconsistent uncertainty reporting limit conclusions about real-world performance.
Why this matters: A model that improves the prediction of tomorrow’s closing price is not automatically useful for monthly portfolio allocation or financial risk management. The target and evaluation method must match the decision the model is intended to support.
Source: Khemka et al., Machine Learning in Stock Market Forecasting: A Comprehensive Review, 2026
These figures describe the review’s selected evidence, not a guaranteed improvement for a new forecasting system.
Research Study: Do Deep Learning Methods Improve Financial Forecasts? OFR, 2026
A blog published by the US Office of Financial Research on August 25, 2026, examined the need for finance-specific benchmarks when evaluating deep learning. The central issue is straightforward: comparing a complex model with a weak baseline can exaggerate its apparent value. A meaningful comparison requires competing methods to use the same data and follow the same evaluation rules.
The discussion highlights a broader problem in financial AI. Model performance can depend on the market, forecast horizon, target variable and evaluation design. There is no reason to assume that a model that performs well on one financial series will perform equally well on another.
This is particularly relevant when an institution is choosing between a conventional econometric model and a deep learning system. A fair benchmark should include credible traditional methods, simple machine learning models and the proposed advanced model. All should be tested using the same information available at the same forecast date.
Practical implication: Financial institutions should maintain a benchmark suite rather than approve a new model because it outperforms one selected competitor. The suite should be versioned and rerun when data, features or model architecture changes.
Research Study: Econometric Models Versus Machine Learning for Volatility Forecasting
A Federal Reserve Finance and Economics Discussion Series paper, originally published in August 2025 and revised in September 2026, compared econometric and machine learning approaches to realized-volatility forecasting for the S&P 500 and 40 US equities.
The study evaluated established approaches including HAR, ARFIMA, threshold HAR, smooth-transition HAR and Markov-switching HAR alongside XGBoost and neural-network models. It assessed forecasts at different horizons and used several statistical and risk-oriented measures, including mean squared forecast error, mean absolute error, QLIKE, realized utility and value-at-risk-related measures.
The findings were important because machine learning did not consistently outperform the broader set of econometric models. Markov-switching HAR performed best at short horizons, while ARFIMA generally led at the monthly horizon. Machine learning sometimes improved on HAR, but the results depended on the forecast horizon and the dynamics being modeled.
This is a useful reminder that volatility forecasting is not the same task as predicting price direction. Volatility models estimate the magnitude or variability of returns and can support risk limits, option pricing, margin planning and portfolio exposure decisions.
Practical implication: For volatility forecasting, test AI against econometric models designed to capture persistence, long memory and regime changes. Model selection should be based on the horizon and risk decision, not on the assumption that neural networks are inherently superior.
Research Study: Machine Learning for Implied Volatility Forecasting, 2026
A July 2026 Federal Reserve study investigated how implied volatility varies across different options contracts. Standard forecasting models often apply similar parameter structures across an options surface, even though contracts can behave differently depending on their maturity and how far their strike price is from the underlying asset price.
The researchers introduced tree-based approaches within a surface heterogeneous autoregressive framework. The approach allowed different parts of the options surface to use different model relationships rather than assuming that one set of parameters fits every contract.
Using S&P 500 options data, the boosted tree-based specification achieved the lowest out-of-sample forecast errors across the horizons examined. It reduced one-month-ahead root mean squared error by 13% compared with the benchmark SHAR model. The study reported that improvements were particularly pronounced during stress periods.
The result illustrates a specific use of AI: learning meaningful differences between groups of financial instruments. Instead of forecasting one market-wide volatility figure, the model can recognize that short-dated, long-dated and out-of-the-money options may have different dynamics.
Practical implication: In options analytics, credit risk and other heterogeneous portfolios, segmentation can be as important as model complexity. Tree-based methods may help identify where relationships differ, while preserving a structure that analysts can inspect.
Research Study: Stock Market Forecasting from Traditional Models to Large Language Models
A 2025 open-access survey published in Computational Economics reviewed stock-market forecasting approaches ranging from traditional predictive models to large language models. It discussed feature engineering, ensemble methods, hybrid models, text-based prediction and reinforcement learning, alongside the potential use of LLMs in financial analytics.
The survey describes how language models can process unstructured information such as financial news and company disclosures. This information can be converted into features for a forecasting model, used to classify events or help analysts interpret complex financial documents.
However, an LLM’s ability to summarize a news article does not prove that it can forecast market returns reliably. News may already be reflected in prices, and a seemingly important event can have different effects depending on expectations, valuation, liquidity and the broader market environment.
The survey therefore supports combining language models with predictive systems rather than treating generated text as a direct trading signal. Structured models can estimate numerical outcomes, while language models can help extract and organize information from text.
Practical implication: Use LLMs to transform unstructured information into auditable features, then test whether those features improve a forecasting model out of sample. Keep the generated explanation separate from the statistical forecast.
Research Study: Hybrid AI for Financial Risk Prediction, 2026
A 2026 study in Discover Artificial Intelligence proposed a hybrid approach to financial risk assessment using structured records and unstructured information. The structured component used the Home Credit Default Risk dataset, containing 307,511 applicant records and 122 features. The framework also extracted contextual signals from financial news and social media through sentiment analysis.
The study illustrates a broader modeling direction: financial prediction can benefit from combining tabular information with text-derived signals. In a lending setting, structured data may describe income, repayment history and credit obligations, while text-based signals may provide context about broader economic or sector conditions.
The distinction between the study’s task and market forecasting matters. Credit-risk prediction is not the same as forecasting equity prices or market volatility. Nevertheless, its hybrid-data design is relevant to financial modeling systems that need to combine numerical records with contextual information.
A key deployment question is whether the extra data improves performance on genuinely unseen cases. Resampling, feature selection and preprocessing must be performed without allowing information from the test period to leak into model development.
Practical implication: Multimodal financial models should demonstrate that each data source adds measurable value. If news or sentiment does not improve out-of-sample performance, it may add complexity without improving the forecast.
Research Evidence: What the Studies Collectively Show
The studies above address different targets, so their numerical results should not be compared as though they measure the same outcome. Together, however, they identify several practical lessons for financial modeling teams.
| Research | Forecasting focus | Main finding | Practical lesson |
|---|---|---|---|
| Discover Computing, 2026 | Multiple financial markets | AI often improves reported errors, but outcomes vary | Use realistic, leakage-safe validation |
| OFR, 2026 | Financial forecasting benchmarks | Comparisons require common data and rules | Maintain a benchmark suite |
| Federal Reserve, 2025–2026 | Realized volatility | Econometric models can outperform ML at some horizons | Match model to horizon |
| Federal Reserve, 2026 | Options implied volatility | Tree-based segmentation reduced one-month RMSE by 13% versus SHAR | Model heterogeneity explicitly |
| Computational Economics, 2025 | Traditional models and LLMs | Text can add context, but requires careful integration | Separate language extraction from forecasting |
| Discover Artificial Intelligence, 2026 | Structured and unstructured risk data | Hybrid data architecture is a growing approach | Test the incremental value of each source |
Financial Forecasting Use Cases for AI
Asset Price and Return Forecasting
AI models can estimate returns or price ranges for equities, bonds, currencies, commodities and digital assets. Useful inputs may include historical returns, volume, volatility, valuation measures, interest rates, earnings data and macroeconomic indicators.
A well-designed system should distinguish between predicting the price level and predicting returns. Price levels can appear highly predictable because they contain a strong historical trend, while return forecasts are often much harder. For trading or allocation decisions, the return distribution and the uncertainty around it are usually more useful than a standalone price target.
Volatility and Market Risk Forecasting
Volatility forecasting supports portfolio risk limits, options pricing, margin management and stress testing. AI can identify nonlinear interactions between recent volatility, market liquidity, macroeconomic variables and asset-specific behavior.
The model should be evaluated at the horizon used by the risk team. A one-day volatility forecast may help with daily exposure controls, while a monthly forecast may be more relevant for capital planning. Performance should also be tested during calm and stressed periods rather than relying on an average score across the entire sample.
Macroeconomic and Interest-Rate Forecasting
Financial institutions use forecasts of inflation, employment, growth, policy rates and credit conditions to support asset allocation, lending and treasury decisions. AI can combine economic releases, yield curves, survey data, market prices and text-based information.
A major difficulty is that macroeconomic data is revised. A model must use the version of each release that was actually available at the forecast date. Training on revised data can create an unrealistically favorable picture of historical performance.
Corporate Revenue and Earnings Forecasting
For company-level modeling, AI can combine historical financial statements, segment results, analyst estimates, management commentary, sector indicators and demand signals. Text models can extract information from filings and earnings-call transcripts, while numerical models estimate revenue, margins, cash flow or earnings surprises.
These forecasts should preserve accounting consistency and distinguish reported facts from estimates. A generated summary should never silently replace the underlying figures or the assumptions used in the financial model.
Liquidity and Cash-Flow Forecasting
Banks, payment providers, fintech companies and large businesses need to forecast incoming and outgoing cash flows. AI can identify recurring patterns, customer payment behavior, seasonal effects and unexpected changes in transaction activity.
The practical value is often operational rather than speculative. Better cash-flow forecasts can support liquidity buffers, treasury planning, funding decisions and early warnings of unusual outflows.
Choosing the Right Model for the Forecast
No single model family is appropriate for every financial problem. The selection should begin with the target, horizon, available data and cost of a wrong forecast.
| Model family | Useful applications | Main consideration |
|---|---|---|
| Econometric models | Returns, volatility, macroeconomic series | Can provide interpretable structure and strong baselines |
| Gradient-boosted trees | Tabular data, nonlinear relationships, heterogeneous groups | Feature design and time-aware validation remain critical |
| LSTM and GRU networks | Sequential and time-dependent patterns | Can overfit and may need substantial tuning |
| Transformers | Long sequences and multimodal data | Compute cost and data requirements |
| NLP and LLMs | News, filings, transcripts, research documents | Extraction errors, hallucinations and timestamp control |
| Ensemble models | Combining complementary forecasts | Added complexity must justify itself out of sample |
Multimodal Financial Data: Prices, Fundamentals, News and Macro Signals
A modern forecasting system may combine several types of data, but each source has different timing, quality and reliability.
Market data
Prices, returns, volume, spreads, order-book measures and realized volatility
Fundamentals
Revenue, margins, cash flow, debt, valuation and earnings estimates
Economic data
Inflation, employment, policy rates, yield curves and economic releases
Unstructured data
News, earnings calls, filings, analyst commentary and sentiment
Combining these sources can provide a richer view of the market, but it also creates opportunities for accidental leakage. A financial statement may describe a quarter that ended months earlier but was published only recently. A news article may be updated after the original publication. A macroeconomic figure may later be revised.
Every observation should therefore include an availability timestamp. Features must be generated from information that was genuinely available at the moment the forecast would have been made.
Market-Regime Detection and Adaptive Forecasting
Financial markets can move between regimes with different volatility, liquidity, correlation and trend characteristics. A model trained on a long period may perform well on average while failing during a sudden change in market conditions.
Regime detection attempts to identify these shifts. Inputs may include realized volatility, yield-curve shape, credit spreads, liquidity measures, correlations, macroeconomic indicators and market breadth. Statistical change-point detection, clustering, hidden Markov models and machine learning classifiers can help describe the current environment.
The goal should not be to label every market movement with certainty. Regime estimates are themselves uncertain, and a model may recognize a change only after some evidence has accumulated. A robust system should therefore track the confidence of its regime classification and test whether a regime-specific forecast actually improves decisions.
Update market data
Estimate regime
Generate scenarios
Monitor errors
A regime-aware system should adjust only when the evidence supports a change, with monitoring and fallback rules in place.
Forecast Accuracy Is Not the Same as Financial Value
A model can reduce mean absolute error or root mean squared error without improving an investment or business decision. Forecasting teams should evaluate statistical performance and economic usefulness separately.
For example, a small improvement in a highly liquid market may have little value if it is smaller than the cost of trading on the signal. Conversely, a modest improvement in a liquidity forecast could be valuable if it helps a bank avoid a costly funding shortfall.
A complete evaluation should consider:
- Forecast error: MAE, RMSE or another metric suited to the target
- Directional accuracy: Whether the model correctly estimates the direction when direction matters
- Calibration: Whether predicted probabilities match observed frequencies
- Economic value: Whether the forecast improves the actual decision after costs
- Risk outcomes: Whether the model improves loss estimates, risk limits or stress preparedness
- Stability: Whether performance remains acceptable across time periods and market regimes
Backtesting Without Inflating Results
Backtesting is one of the most important parts of predictive financial modeling, but it is also a common source of misleading results. Repeatedly testing many models, features and parameter combinations on the same historical period can produce a strategy that fits past noise.
A credible validation process should use chronological splits. Training data should precede validation data, and the final test period should remain untouched until model selection is complete. For time-series tasks, rolling or expanding-window evaluation can show how performance changes as the model is retrained through time.
Data transformations must also be fitted only on the training period. Normalization, feature selection, imputation and dimensionality reduction can all leak future information if applied incorrectly. For trading applications, the backtest should include realistic transaction costs, slippage, market impact, funding costs and execution constraints.
Recommended validation structure:
Fit models and transformations
Select features and tune
Estimate unseen performance
The final test should not become another tuning set. If repeated experimentation influences model choices, a new holdout period or a properly designed nested validation procedure may be needed.
Uncertainty Quantification and Scenario Forecasting
Financial decisions rarely depend on a single expected value. A treasury team may need to know the range of possible cash outflows, while a portfolio manager may care about the probability of a large drawdown. Forecasting systems should therefore provide uncertainty estimates alongside point predictions.
Depending on the task, this may involve prediction intervals, quantile forecasts, probabilistic models, scenario analysis or ensembles. Calibration should be tested over time because a model that was well calibrated in a quiet market may underestimate uncertainty during a crisis.
Scenario analysis is particularly useful when historical data cannot fully represent a future event. Institutions can combine model forecasts with clearly stated stress assumptions, such as a sharp interest-rate change, a liquidity shock or a sudden increase in credit spreads. These scenarios are not predictions; they are structured ways to understand exposure under plausible conditions.
Explainability, Governance and Model Risk
Financial forecasts can influence investment decisions, credit allocation, liquidity management and regulatory reporting. Organizations therefore need to understand how models behave and how their outputs are used.
Explainability does not require every model to be reduced to a simple formula. It does require appropriate evidence about the factors driving predictions, the conditions under which performance deteriorates and the limits of the model. Feature importance, sensitivity analysis, scenario testing and local explanations can help, but they should not be treated as proof that a model is correct.
Governance should cover the full lifecycle.
- Document the model’s intended use, target and forecast horizon
- Record data sources, licensing conditions and availability timestamps
- Maintain reproducible training and evaluation pipelines
- Compare performance with approved benchmarks
- Monitor forecast errors, calibration and drift
- Define escalation thresholds and fallback models
- Keep an audit trail of forecasts and decisions
- Require appropriate human approval for high-impact uses
Expert Recommendation
Financial institutions should build forecasting systems around a disciplined model-selection process rather than a preference for the newest AI architecture. Start with a clearly defined decision, establish a credible statistical baseline and then test whether machine learning adds measurable value under the same data and validation conditions.
For most organizations, a hybrid architecture is a practical starting point. Use econometric models where they capture persistence, volatility or established relationships well. Add tree-based machine learning for nonlinear tabular patterns, deep learning when the sequence or data scale justifies it, and language models when unstructured documents contain relevant information.
The deployment decision should depend on out-of-sample performance, calibration, stability, operational cost and the consequences of forecast errors. If a simpler model performs similarly, it may be easier to explain, validate and maintain. Advanced AI should earn its place through evidence.
Expert Perspective
This is a more useful guide for financial AI than a promise that one model can consistently predict markets. The evidence points toward careful evaluation, transparent limits and systems designed to adapt when conditions change.
Implementation Roadmap for Financial Institutions
Define the forecast target, collect licensed data and preserve point-in-time availability
Build simple statistical and financial benchmarks before introducing advanced AI
Test candidate models with identical data splits and documented metrics
Measure the effect on the real workflow, including costs and downside risk
Track drift, forecast quality, uncertainty and fallback conditions
KPIs for AI Financial Forecasting
| KPI | What it measures | Why it matters |
|---|---|---|
| MAE / RMSE | Average forecast error | Measures predictive accuracy |
| Directional accuracy | Correct direction estimates | Useful where direction drives decisions |
| Calibration | Reliability of probabilities or intervals | Supports risk-aware decisions |
| Performance by regime | Stability across market conditions | Reveals hidden weaknesses |
| Economic value | Decision improvement after costs | Connects forecasts to business outcomes |
| Drift indicators | Changes in data or model behavior | Triggers review or retraining |
Future Outlook: 2027–2030
More Finance-Specific AI Benchmarks
As financial AI adoption expands, model evaluation is likely to place greater emphasis on common benchmarks, point-in-time data and consistent testing procedures. This will make it easier for institutions to distinguish genuine improvements from results caused by different datasets or experimental choices.
Hybrid Models Will Remain Important
The evidence does not suggest that traditional econometric methods will disappear. Instead, financial teams are likely to combine statistical models with machine learning where each adds value. Model selection may become more conditional on forecast horizon, asset class, data quality and the type of risk being estimated.
More Forecasts Will Include Uncertainty
Financial institutions will have stronger reasons to move beyond single-number predictions. Prediction intervals, quantile estimates and scenario distributions can help decision-makers understand the range of possible outcomes and the risks associated with a forecast.
Language Models Will Become Data Interfaces
LLMs are likely to be used more widely to extract information from earnings calls, filings, economic releases and research documents. Their most dependable role may be to turn unstructured information into traceable features and summaries that can be checked, rather than to generate unsupported market predictions directly.
Model Risk Will Become a Product Requirement
As AI forecasts become embedded in financial workflows, buyers will increasingly expect monitoring, explainability, versioning, audit logs and fallback behavior. These capabilities will become part of the product architecture rather than optional additions after a model is built.
Forecasting Will Be Evaluated by Decision Quality
A model’s commercial value will increasingly be assessed through the decisions it improves. This may include better liquidity planning, more stable risk limits, improved scenario analysis or more efficient portfolio allocation. Raw accuracy will remain important, but it will not be sufficient on its own.
Startup Opportunities in AI Financial Forecasting
- Forecasting-as-a-Service: APIs for asset returns, volatility, macroeconomic indicators or business cash flows
- Financial Model Validation: Tools for leakage detection, benchmark comparisons and time-series backtesting
- AI Scenario Analysis: Platforms that translate economic scenarios into portfolio, credit or liquidity impacts
- Point-in-Time Data Infrastructure: Systems that preserve what information was available at each historical forecast date
- Financial Document Intelligence: Tools that extract structured signals from filings, earnings calls and economic releases
- Forecast Monitoring: Products that track drift, calibration, model degradation and forecast error
- Model Governance Platforms: Audit trails, documentation and approval workflows for financial AI
A particularly practical opportunity is a forecasting validation platform for financial institutions. It could compare candidate models against approved benchmarks, test multiple market regimes, identify data leakage risks and generate a reproducible report for model-risk teams.
Frequently Asked Questions
What is AI in predictive financial modeling?
AI in predictive financial modeling uses machine learning, deep learning and related techniques to estimate future financial outcomes from historical and current data. Applications include asset returns, volatility, cash flow, credit risk, revenue and macroeconomic forecasting.
Can AI predict the stock market accurately?
AI can identify patterns that improve some forecasting tasks, but financial markets are noisy and change over time. Results vary by asset, horizon, dataset and validation method. A strong historical result does not guarantee reliable future performance.
Which AI model is best for financial forecasting?
There is no universally best model. Econometric models, gradient-boosted trees, recurrent networks, Transformers and ensembles should be compared against credible baselines using the same data and evaluation design.
How is AI used in volatility forecasting?
AI can estimate future variability in asset returns by learning relationships between historical volatility, market conditions and other predictors. These forecasts can support risk management, options analysis and portfolio exposure decisions.
Can large language models forecast financial markets?
LLMs can process news, filings and financial commentary, but their ability to interpret text does not guarantee profitable or accurate market forecasts. A safer approach is to use them for structured information extraction and test whether the resulting features improve a separate forecasting model.
Why is data leakage dangerous in financial AI?
Data leakage occurs when a model uses information that would not have been available at the time of the forecast. It can make backtests appear much more accurate than a real deployment would be. Point-in-time data and chronological validation help reduce this risk.
How should financial institutions evaluate an AI forecasting model?
They should measure forecast error, calibration, stability across market regimes and the impact on the intended decision. Trading-related models should also account for transaction costs, slippage, liquidity and execution constraints.
Will AI replace financial analysts and quantitative researchers?
AI can automate parts of data processing, forecasting and scenario analysis, but human expertise remains important for selecting assumptions, interpreting uncertainty, understanding market context and deciding how forecasts should be used.
Final Perspective
AI is expanding what financial forecasting systems can analyze, but its value depends on the quality of the evidence behind each prediction. The latest research shows that machine learning can improve forecasting errors in many controlled comparisons, while also demonstrating that gains vary across tasks and horizons.
Federal Reserve studies provide a particularly useful counterpoint to simplistic claims about AI superiority: carefully designed econometric models can still outperform machine learning in specific volatility forecasting settings, while tree-based AI can add value when financial instruments exhibit different behaviors.
For financial institutions, the strongest approach is to build forecasting systems around a defined decision and a credible evaluation process. Point-in-time data, realistic benchmarks, chronological testing, uncertainty estimates and continuous monitoring should be treated as core requirements. Language models and multimodal systems can extend the available information, but every additional source should demonstrate measurable value.
The goal is not to predict every market movement. It is to improve the quality of decisions under uncertainty.
AI forecasting works best when predictive performance, financial context, risk management and human judgment are designed as one system.
Research Sources
- Khemka et al., Machine Learning in Stock Market Forecasting: A Comprehensive Review, Discover Computing, 2026
- Office of Financial Research, Do Deep Learning Methods Improve Financial Forecasts?, August 2026
- Federal Reserve, Linear and Nonlinear Econometric Models versus Machine-Learning Models: Evidence from Realized-Volatility Forecasting, revised September 2026
- Federal Reserve, Capturing Heterogeneity: Machine Learning Approaches to Implied Volatility Forecasting, July 2026
- Darwish, Hassanien and Eissa, Stock Market Forecasting: From Traditional Predictive Models to Large Language Models, Computational Economics, 2025
- Discover Artificial Intelligence, Enhanced Predictive Modeling for Financial Risk Assessment Using Hybrid AI on Structured and Unstructured Data, 2026
- Federal Reserve Bank of New York, Artificial Intelligence and Monetary Policy: A Framework and Perspective on Cyclical Transmission, Structural Transition, and Financial Stability, 2026
- Federal Reserve, Financial Stability Report

Leave a Reply