
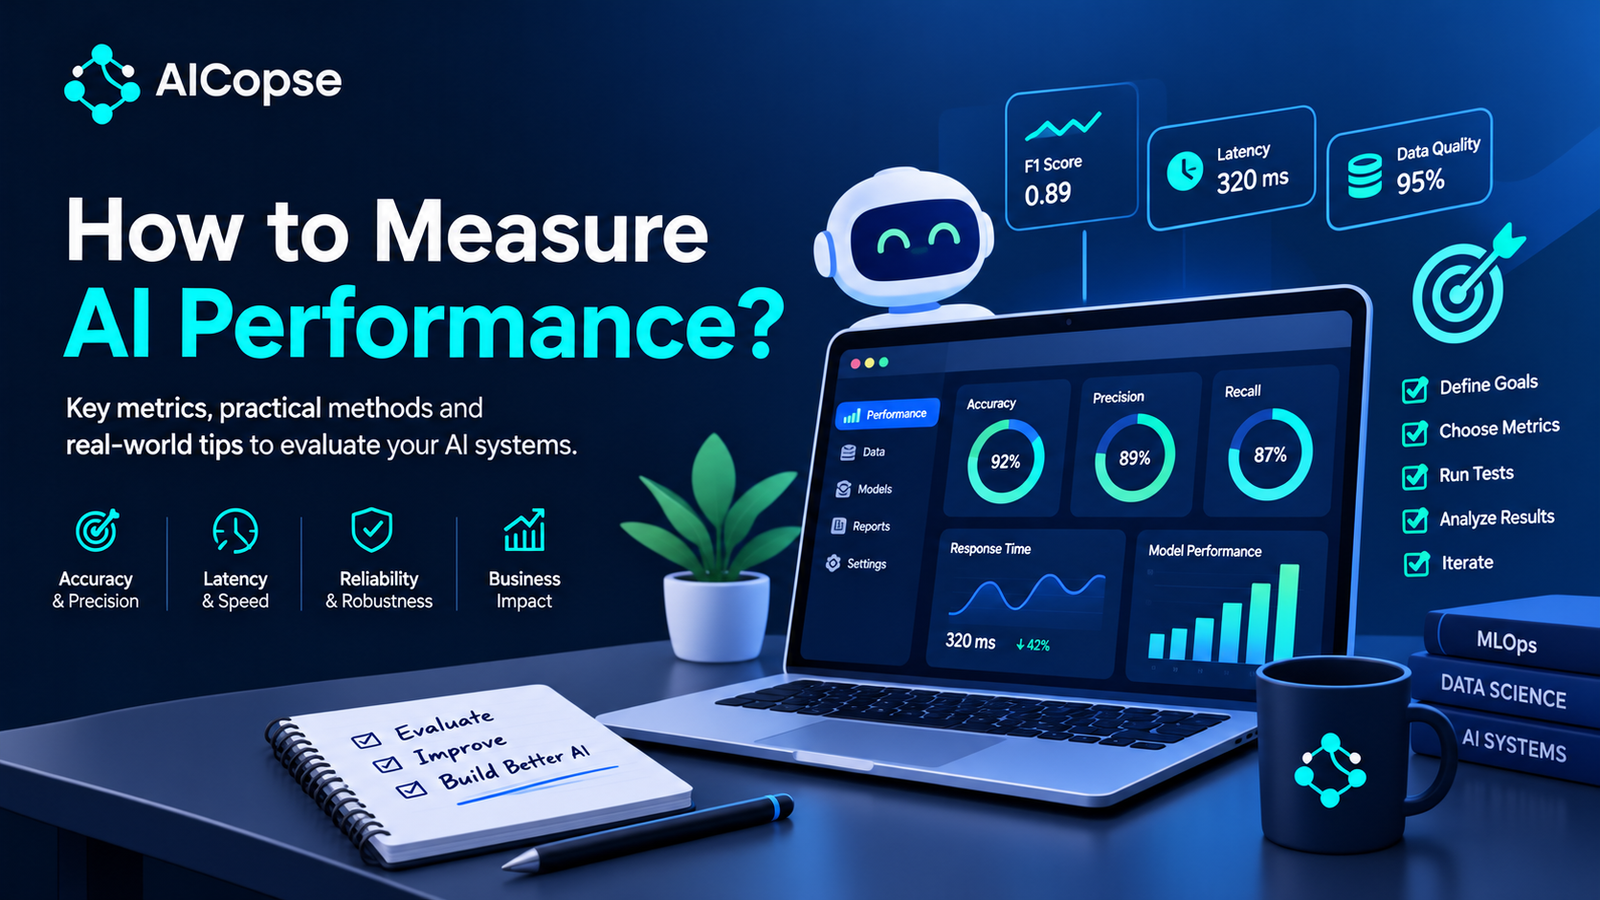
In 2025 researchers at METR ran a randomized trial with experienced software developers. The developers using AI tools took 19% longer to finish their tasks, yet afterwards they believed AI had made them about 20% faster. They were wrong about their own productivity, and they did not know it. That single result explains why measuring AI properly matters: feelings and demos are not measurements.
The business side tells the same story. A widely cited MIT NANDA study found that about 95% of enterprise generative AI pilots showed no measurable business impact. Many of those projects probably had no clear measurement plan from day one.
This guide shows you how to measure AI performance in a way that holds up: the five layers to track, a step-by-step method, the right metrics for each type of AI, how to use and not misuse benchmarks and LLM judges, how to measure ROI, and how to monitor in production. It also covers how AI forward deployed engineers and software forward deployed engineers measure success differently.
What “AI Performance” Really Means
AI performance is how well an AI system does a specific job, for specific people, at an acceptable cost and risk. There is no single score for it. A model that wins a public leaderboard can still fail your customers, and a model with modest benchmark numbers can save your team hours every week.
Before you pick any metric, answer four questions in plain words:
- What job is the AI doing? (Route support tickets, summarise contracts, detect fraud, write code.)
- For whom, and what does a good result look like to them?
- What does a mistake cost? (An awkward sentence is cheap. A missed allergy in a medical note is not.)
- What is the alternative? (A human, an older rule-based system, or doing nothing.)
The Five Layers of AI Measurement
Most teams measure only the first layer. Good measurement covers all five, from the model up to the business.
| Layer | Question it answers | Example metrics |
|---|---|---|
| 1. Model quality | Is it right? | Accuracy, precision, recall, F1, error rate, groundedness |
| 2. System quality | Does the full pipeline work reliably and affordably? | Latency (median and slowest 5%), cost per request, uptime, retrieval quality |
| 3. User outcome | Do people succeed and keep using it? | Task success rate, adoption, human override rate, satisfaction |
| 4. Business impact | Is it worth the money? | Hours saved, cost per task, revenue or retention change, payback period |
| 5. Risk and trust | Is it safe, fair and compliant? | Performance by group, harmful-output rate, data leakage tests, audit trail |
A system can score well on layer 1 and fail on layer 3 (people do not trust it) or layer 4 (it costs more than it saves). Tracking all five stops you from celebrating a number that does not matter.
An 8-Step Method That Works
| Step | What to do | Why it matters |
|---|---|---|
| 1. Define the job | Write one sentence on what the AI must do and what “good” means. | Metrics without a goal measure nothing useful. |
| 2. Set a baseline | Measure the current method: human, old system or simple rules. | “90% accurate” means little until you know humans score 85% or 97%. |
| 3. Build a golden dataset | Collect real cases with correct answers, labelled by domain experts. | Real data beats invented examples. Include hard and rare cases. |
| 4. Pick metrics that match the cost of mistakes | If missing a case is worse than a false alarm, prioritise recall; the reverse, precision. | The right metric depends on what hurts. |
| 5. Score it | Use exact checks where possible, an AI judge for open-ended text, and human review on a sample. | Automation gives speed; humans give ground truth. |
| 6. Check the uncertainty | Add a confidence interval, and compare versions on the same test set. | A small test set can make a 67% score mean 33% to 100% (see the code below). |
| 7. Slice the results | Break scores down by case type, language, customer segment and user group. | An average can hide a group the system fails badly. |
| 8. Monitor and repeat | Re-run the tests after every model, prompt or data change and sample live traffic. | AI systems drift, and a good launch score does not last forever. |
Metrics Cheat Sheet by Type of AI
| Type of AI | Key metrics | Watch out for |
|---|---|---|
| Classification (spam, fraud, diagnosis) | Precision, recall, F1, AUC-ROC, confusion matrix | Accuracy misleads when one class is rare. |
| Prediction of numbers (prices, demand) | Mean absolute error (MAE), RMSE, R² | One average can hide large errors on important cases. |
| Search and recommendation | NDCG, click-through rate, conversion, coverage | Clicks can reward addictive but unhelpful results. |
| Text generation and translation | BLEU, ROUGE, BERTScore, human ratings | Word-overlap metrics miss meaning; always add human review. |
| LLM question answering and RAG | Groundedness (is it supported by the sources), context relevance, answer relevance, hallucination rate | A fluent answer can be false; check against the retrieved documents. |
| AI agents | Task success rate, correct tool use, steps per task, recovery from errors, cost per task | Measure end-to-end results, not each step alone; run each task several times because outputs vary. |
| Speech and vision | Word error rate (speech); IoU and mAP (object detection) | Accents, lighting and noise change results; test on real conditions. |
| Efficiency (any AI) | Latency at the median and the slowest 5%, throughput, cost per request | Average speed hides the slow cases users actually notice. |
| Safety and fairness | Scores broken down by group, harmful-output rate, red-team pass rate | A good overall score can hide poor results for a small group. |
Precision and recall in plain words: precision asks “when the AI says yes, how often is it right?” and recall asks “of all the real yes cases, how many did it catch?” F1 combines the two. For a fraud detector, recall matters because missed fraud costs money, but precision matters too because false alarms annoy customers.
Two Code Examples That Show Why Metrics Mislead
These short Python examples use scikit-learn and NumPy. We ran both, and the outputs shown are real.
Example 1: The accuracy trap
Imagine a fraud detector tested on 1,000 transactions where only 10 are fraud. Model A lazily says “not fraud” every time. Model B is a real detector that catches 8 of the 10 frauds and raises 20 false alarms.
from sklearn.metrics import accuracy_score, precision_score, recall_score, f1_score

y_true = [1]*10 + [0]*990                         # 10 frauds in 1,000 transactions
lazy   = [0]*1000                                  # Model A: always "not fraud"
smart  = [1]*8 + [0]*2 + [1]*20 + [0]*970          # Model B: 8 caught, 20 false alarms

for name, pred in [("A (always 'not fraud')", lazy), ("B (real detector)", smart)]:
    print(f"{name:24} accuracy={accuracy_score(y_true, pred):.3f} "
          f"precision={precision_score(y_true, pred, zero_division=0):.2f} "
          f"recall={recall_score(y_true, pred):.2f} f1={f1_score(y_true, pred):.2f}")

# A (always 'not fraud')   accuracy=0.990 precision=0.00 recall=0.00 f1=0.00
# B (real detector)        accuracy=0.978 precision=0.29 recall=0.80 f1=0.42
What this shows: the useless model has the higher accuracy (99.0% versus 97.8%) because fraud is rare. Only recall exposes that it catches nothing. If you reported accuracy alone, you would ship the wrong model.
Example 2: How much should you trust a score?
Three teams all report that their AI scores 67% on their test set. The difference is how many test cases they used. The code below estimates a 95% confidence interval with bootstrapping, which means re-sampling the test results many times to see how much the score could move by chance.
import numpy as np

rng = np.random.default_rng(42)

def ci(correct, total, n=10000):
    results = np.array([1]*correct + [0]*(total - correct))
    means = [rng.choice(results, size=total, replace=True).mean() for _ in range(n)]
    lo, hi = np.percentile(means, [2.5, 97.5])
    return correct/total, lo, hi

for correct, total in [(4, 6), (80, 120), (800, 1200)]:
    s, lo, hi = ci(correct, total)
    print(f"{correct}/{total}: score={s:.0%}  95% interval={lo:.0%} to {hi:.0%}")

# 4/6: score=67%  95% interval=33% to 100%
# 80/120: score=67%  95% interval=58% to 75%
# 800/1200: score=67%  95% interval=64% to 69%
What this shows: with 6 test cases, “67%” could really mean anywhere from 33% to 100%. With 120 cases the range narrows to 58% to 75%, and with 1,200 cases to 64% to 69%. Never compare two versions of an AI on a few dozen cases and declare a winner. Report the interval, and grow the test set before you make a decision.
Benchmarks: What They Can and Cannot Tell You
Benchmarks are standard tests that let you compare models on the same tasks. They are useful for shortlisting, but they rarely predict how a model will perform on your data.
| Benchmark type | Example | Good for |
|---|---|---|
| Knowledge and reasoning tests | Academic question sets run through EleutherAI’s lm-evaluation-harness | Comparing base models on standard tasks |
| Coding and software tasks | Test-based coding benchmarks | Checking whether generated code passes tests |
| Human-preference rankings | Chatbot Arena-style head-to-head voting | Overall conversational quality as people perceive it |
| Speed and efficiency | MLPerf | How fast models run on different hardware |
Four reasons not to trust a benchmark alone
- Contamination. If benchmark questions, or close variants, appear in a model’s training data, scores inflate. Researchers note that detection methods catch direct leakage better than paraphrased leakage.
- Saturation. When top models all score near the ceiling, the test stops separating them.
- Mismatch. A general test does not cover your documents, your customers, your language or your risks.
- Goodhart’s law. Once a number becomes the target, people optimise it, and it stops measuring what you cared about.
The rule: use public benchmarks to build a shortlist, then decide using a test set built from your own cases.
Using an AI to Judge AI (LLM-as-a-Judge)
For open-ended answers such as summaries, explanations or chat replies, exact matching does not work. Many teams use a second AI model to grade the first against a written rubric. It scales well, but research has documented consistent biases:
| Bias | What happens | Fix |
|---|---|---|
| Position bias | The judge favours the answer shown first (or last) | Run each comparison twice with the order swapped |
| Verbosity bias | Longer answers score higher even when they say less | Add conciseness to the rubric; compare to a reference answer |
| Self-preference bias | A judge rates outputs from its own model family higher | Use a judge from a different provider; hide which model wrote the answer |
Best practice: treat the judge as a model that needs testing too. Check its agreement with human experts on a sample, watch for drift as the judge model is updated, and keep humans in the loop for anything high-stakes.
The Measurement Trap: What the METR Study Teaches
The METR trial is the best-known example of how hard it is to measure AI’s real effect, and it contains lessons for every team.
| What happened | The lesson |
|---|---|
| In a randomized trial published in July 2025, 16 experienced open-source developers completed 246 real tasks, each randomly assigned to “AI allowed” or “AI not allowed.” With AI, tasks took 19% longer. | Randomisation beats opinion. Comparing matched conditions reveals effects that surveys cannot. |
| Before starting, the developers expected AI to make them 24% faster. Afterwards they still believed it had made them about 20% faster. | Self-reported productivity is unreliable. Feelings and measured results can point in opposite directions. |
| The 19% result came with a wide margin of error (roughly 2% to 39% slower). | Always report uncertainty, as in the bootstrap example above. |
| A 2026 follow-up changed its design. Many invited developers refused to work without AI, which biased who took part, and tracking time was hard for developers running several AI agents at once. METR’s own view was that the tools likely help in early 2026, but the design could no longer size the effect. | Selection effects and fast-changing tools break measurements. Re-measure, and note exactly which tools and period a result covers. |
The durable takeaway is not “AI slows people down” or “AI speeds people up.” It is that you must measure your own team on your own tasks, against a real comparison, and distrust how productive everyone feels.
Measuring Business Impact and ROI
Business measurement starts with the outcome the business already tracks, not with an AI metric. Pick two or three:
- Time: minutes per task, turnaround time, hours saved per week.
- Quality: error rate, rework rate, customer satisfaction.
- Money: cost per task, revenue per customer, churn, payback period.
- Adoption: weekly active users, share of tasks where the AI is actually used, how often humans override or redo its output.
Adoption is the number teams forget. An AI that is 95% accurate but used on 10% of tasks delivers a tenth of its promise.
Net benefit = (hours saved per task × tasks per month × adoption rate × cost per hour) − (licences + compute + integration + human oversight)
Illustrative example (invented numbers): 6 minutes saved per task, 10,000 tasks a month, 60% adoption and $30 an hour gives 600 hours saved, worth $18,000. If total monthly costs are $9,000, the net benefit is $9,000 a month.
Three rules keep ROI honest. Measure against a baseline from before the AI. Use a holdout group (some users or tasks without the AI) so you can see what would have happened anyway. And count the oversight cost: time humans spend checking AI output belongs on the cost side.
Measuring Risk, Fairness and Safety
Overall scores hide uneven results. Disaggregated evaluation means computing the same metric separately for each group, such as language, region, age band or customer segment, so you can see who the system fails. Research from Microsoft has focused on getting reliable estimates even for very small subgroups.
The US National Institute of Standards and Technology’s AI Risk Management Framework organises AI risk work into four functions: Govern, Map, Measure and Manage. Measuring sits in the middle, which makes the point that measurement must feed decisions, not just reports. In regulated industries, documented validation is also a legal expectation. Banking model-risk guidance such as SR 11-7 and rules such as the EU AI Act expect evidence of testing, monitoring and governance.
| Risk | How to measure it |
|---|---|
| Unfair results | Same metric, broken down by group; flag large gaps. |
| Harmful or false output | Hallucination and policy-violation rates on a curated test set, plus red-team attempts. |
| Data leakage | Tests that try to extract private data; check permissions on retrieved documents. |
| Robustness | Score on typos, odd phrasing, noisy inputs and out-of-scope questions. |
| Explainability and audit | Can you reconstruct why a decision was made? Logs, sources cited, versions recorded. |
Monitoring After Launch
A launch score is a snapshot. Real use brings new inputs, new user behaviour and model updates. Plan for three kinds of change: data drift (inputs change), concept drift (what a correct answer means changes) and system change (a new model or prompt version).
| Signal | How to track it | When |
|---|---|---|
| Regression tests | Re-run the golden dataset; block a release if the score drops | Every model, prompt or data change |
| Sampled human review | Experts grade a random slice of live outputs | Weekly or monthly |
| User signals | Thumbs up and down, overrides, escalations, abandoned sessions | Continuous |
| Operational health | Latency, error rate, cost per request, uptime | Continuous, with alerts |
| Input drift | Compare today’s inputs with the test set; add new case types to it | Monthly |
Tools for Measuring AI
You do not need to build everything yourself. In 2026 the open-source options cover most needs:
| Tool | Best for |
|---|---|
| Promptfoo | Prompt and model comparisons and regression tests, configured in YAML and suited to CI pipelines |
| DeepEval | Python-native testing of LLM applications in the style of pytest |
| Inspect AI | Task-based evaluations and agent testing, from the UK AI Security Institute |
| lm-evaluation-harness | Running standard academic benchmarks on language models |
| Ragas | Retrieval-augmented generation metrics; a mid-2026 repository review noted no new commits since February 2026, so check its maintenance before depending on it |
| Platforms such as Braintrust, LangSmith and Arize | Human annotation, dashboards, regression tracking and observability for teams |
A common pattern is a lightweight open-source framework gating each release in CI, paired with a platform for human review, tracking and stakeholder dashboards. Pick one tool, write 30 to 50 real test cases and run them before you evaluate more tools.
How Forward Deployed Engineers Measure AI: AI FDE vs Software FDE
Forward deployed engineers (FDEs) are the engineers who embed with customers to make software or AI actually work, so measurement is central to their job. The two flavours measure success differently. A software FDE deploys a platform and its pipelines and apps, which behave the same way every time. An AI FDE deploys models and agents whose answers vary, so quality has to be measured, not just tested.
| What they measure | Software FDE | AI FDE |
|---|---|---|
| Correctness | Unit and integration tests that pass or fail | Eval score on the customer’s golden dataset, with confidence intervals |
| Data quality | Pipeline accuracy, completeness, freshness | Retrieval quality, groundedness, and whether the model sees only permitted data |
| Reliability | Uptime, error rates, response time | Same, plus consistency across repeated runs, drift and cost per task |
| Trust and adoption | Active users, workflows moved to the system | Active users, human override and escalation rates, share of tasks completed without rework |
| Business result | Time or cost saved in the customer’s process | The same, measured against a baseline and a holdout group |
| Feedback to HQ | Feature requests and platform fixes | New eval cases, failure patterns and model or product feedback |
OpenAI’s own forward deployed engineering postings describe the AI version well: engineers are measured on production adoption, measurable workflow impact and feedback grounded in evals. That mirrors the five layers in this guide, from model quality up to business impact. The practical lesson for anyone deploying AI is the AI FDE habit: agree on the test set and the success threshold with the customer before building, then report the score and its uncertainty at every milestone.
Common Mistakes When Measuring AI
| Mistake | Better practice |
|---|---|
| Reporting accuracy alone | Add precision, recall and the cost of each error type. |
| Testing on data the model has seen | Hold out a test set the model never trained or tuned on. |
| No baseline | Measure the human or old system first. |
| A tiny test set | Grow it and report confidence intervals. |
| Trusting public benchmarks for your use case | Build a test set from your own real cases. |
| Using an unchecked AI judge | Swap answer order, use a different judge model, calibrate with humans. |
| Ignoring cost and speed | Track cost per task and slow-case latency alongside quality. |
| Relying on averages | Slice results by group and case type. |
| Measuring once at launch | Re-run regression tests on every change and monitor live use. |
| Asking people how productive they feel | Measure time and outcomes against a comparison group. |
An AI Measurement Scorecard You Can Copy
Fill this in before you build and review it at every milestone.
| Layer | Metric | Baseline today | Target to ship | Owner |
|---|---|---|---|---|
| Model quality | e.g. recall on critical cases | |||
| System quality | e.g. slowest-5% latency, cost per task | |||
| User outcome | e.g. task success, override rate | |||
| Business impact | e.g. hours saved, net monthly benefit | |||
| Risk and trust | e.g. worst-group score, harmful-output rate |
Common Myths About Measuring AI
| Myth | Reality |
|---|---|
| “The top model on the leaderboard is best for us.” | Only your own test set can tell you that. |
| “High accuracy means a good model.” | With rare events, a useless model can score 99%. |
| “If users like it, it works.” | Developers in the METR trial liked AI and were measured slower. |
| “An AI judge removes the need for humans.” | Judges have biases and need human calibration. |
| “We measured it at launch, so we are done.” | Data, users and models change, so performance drifts. |
| “Measuring ROI is impossible for AI.” | It is possible with a baseline, a holdout group and honest costs. |
Frequently Asked Questions About Measuring AI Performance
How do you measure AI performance?
Define the job, set a baseline, build a test set of real cases with correct answers, score the AI or Superintelligence with metrics that match the cost of mistakes, add confidence intervals, check results by group and keep monitoring after launch.
What are the key metrics for evaluating AI?
It depends on the type: accuracy, precision, recall and F1 for classification; MAE and RMSE for numeric prediction; groundedness and hallucination rate for LLM answers; task success and cost per task for agents; plus latency, cost and fairness across every type.
How do you measure the performance of an LLM?
Use a golden dataset of real prompts with expected answers or a scoring rubric, grade with exact checks where possible and an AI judge elsewhere, validate the judge against human reviewers, and track groundedness, correctness, cost and latency.
How do you measure the ROI of AI?
Compare outcomes to a pre-AI baseline, ideally with a holdout group. Count hours saved, error reduction and revenue effects multiplied by adoption, then subtract licences, compute, integration and the time humans spend checking output.
What is a golden dataset?
A set of real examples with correct answers, usually labelled by domain experts, used to test an AI system repeatedly. It is the foundation of reliable evaluation.
Are benchmarks reliable?
They are useful for comparing models in general, but they can be contaminated by training data, can saturate and may not match your task. Use them to shortlist and your own test set to decide.
What is LLM-as-a-judge?
Using one AI model to grade another model’s outputs against a rubric. It scales well but shows position, verbosity and self-preference biases, so test and calibrate it against human judgement.
How is measuring an AI FDE different from a software FDE?
A software FDE relies on pass-or-fail tests and operational metrics, because the system behaves the same every time. An AI FDE also builds eval sets with the customer and reports scores with uncertainty, because model outputs vary.
How many test cases do I need?
As many as it takes for the confidence interval to be narrow enough for your decision. In our example, 6 cases left a 67% score anywhere from 33% to 100%, while 1,200 cases narrowed it to 64% to 69%. Start with 30 to 50 real cases and grow from there.
How often should I re-measure?
On every model, prompt or data change, with sampled human review weekly or monthly and continuous monitoring of user signals, latency and cost.
Key Takeaways
- Measure AI at five layers: model quality, system quality, user outcome, business impact and risk.
- Start with the job and a baseline, then build a golden dataset from real cases.
- Accuracy misleads when events are rare; choose metrics by the cost of each mistake.
- Always report uncertainty: small test sets make scores almost meaningless.
- Use public benchmarks to shortlist, and your own test set to decide.
- Test your AI judge, because judges are biased toward position, length and their own outputs.
- Do not trust how productive people feel. The METR trial shows measurement beats perception.
- Measure adoption and cost with a baseline and holdout group to get honest ROI, then monitor after launch.
We update this guide as evaluation tools and research change. Bookmark it and follow the AICopse AI Updates for daily AI coverage.
Sources and further reading:
- ScienceBlog: METR randomized trial on AI coding tools (July 2025 study)
- Andrew Wegner: METR follow-up results and confidence intervals
- Philipp Dubach: METR study, selection effects and the 2026 design change
- The New Stack: Forward deployed engineer is AI’s hottest job (cites MIT NANDA’s 95% finding)
- Szymon Paluch: What is a forward deployed engineer? (OpenAI posting language on adoption, workflow impact and evals)
- Weights & Biases: Exploring LLM-as-a-Judge
- arXiv: Self-Preference Bias in LLM-as-a-Judge
- arXiv: Auditing behavioural dependence and bias in LLM judges, including benchmark contamination
- arXiv: A Conceptual Framework for AI Capability Evaluations
- arXiv: Structured regression for disaggregated evaluation across subgroups
- Techsy: Open-source LLM evaluation frameworks in 2026
- Inference.net: LLM evaluation tools comparison (February 2026)
- Neontri: Measuring AI performance in regulated industries (SR 11-7 and the EU AI Act)

Leave a Reply