
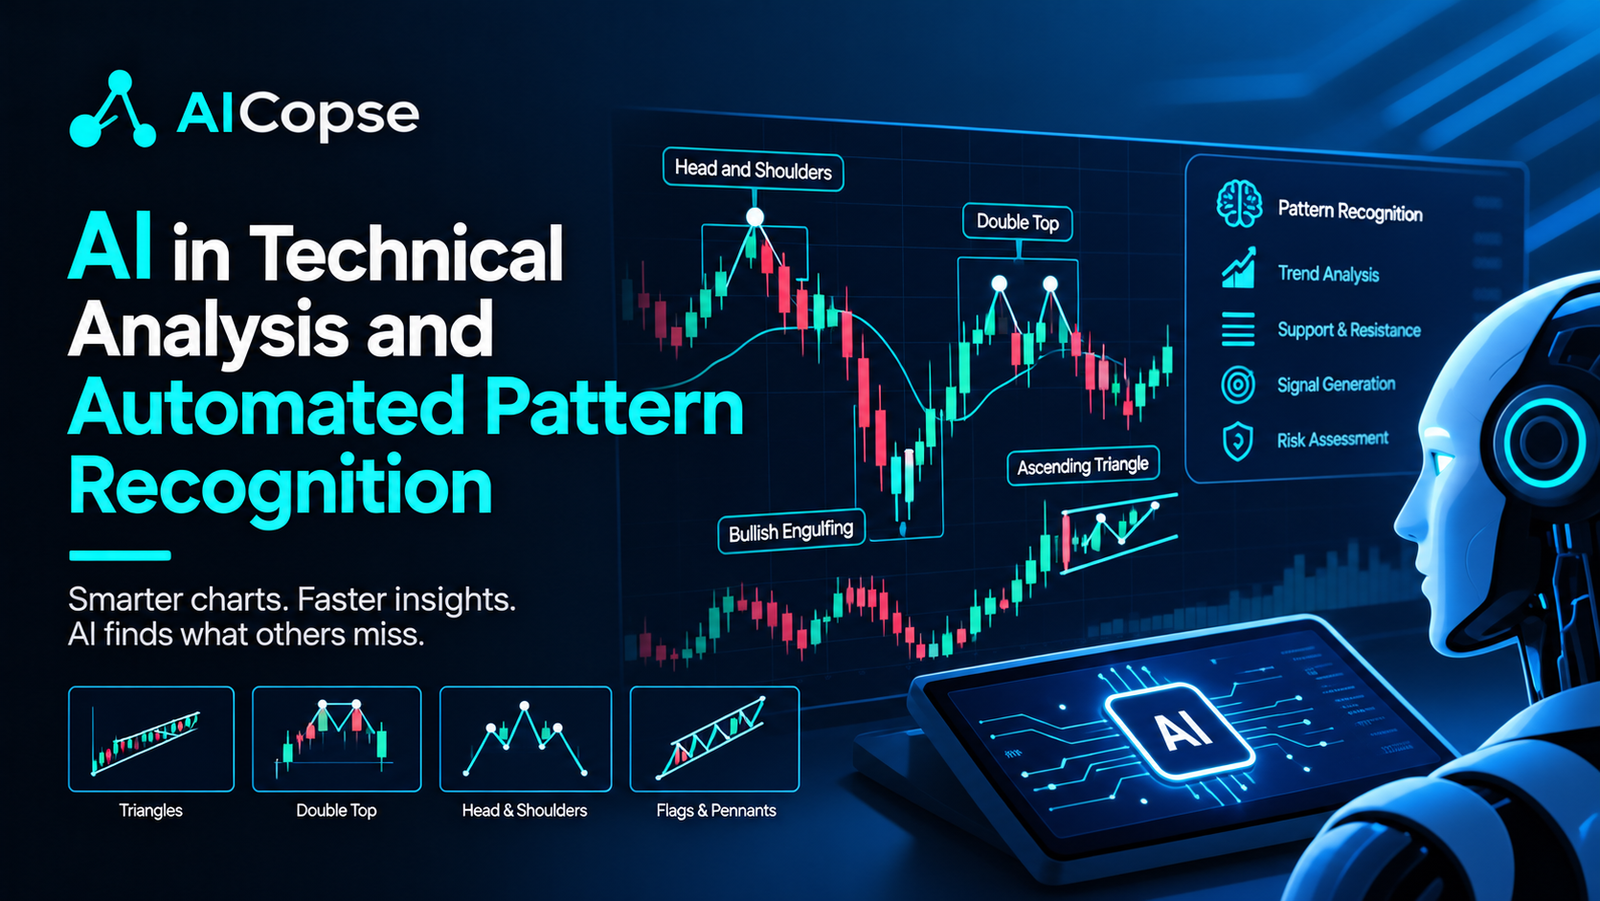
Key finding: AI can make chart analysis more consistent and help identify complex relationships in market data. However, recognizing a pattern is not the same as predicting a profitable trade. Reliable systems require realistic testing, risk controls, transaction-cost analysis, and continuous monitoring.
Technical analysis has long been used by traders to study price movements, trading volume, momentum, and recurring chart formations. Patterns such as head and shoulders, double tops, support and resistance, triangles, and candlestick formations help traders organize market information and develop trading decisions. The challenge is that people can interpret the same chart differently, and a pattern that appears convincing in historical data may fail in a live market.
Artificial intelligence is changing how these patterns can be detected and evaluated. Machine learning models can analyze large amounts of historical market data, compare price formations across thousands of instruments, and estimate whether certain conditions are associated with a higher or lower probability of future price movements. Computer vision can also analyze chart images, while deep learning models can learn directly from sequences of prices, returns, and volume.
For developers, fintech startups, trading firms, and financial institutions, the opportunity is not simply to build another automated buy-and-sell bot. The greater opportunity is to develop systems that detect patterns objectively, explain why a signal appeared, measure its historical reliability, and manage the risks of acting on it.
This report examines the technology, research evidence, practical applications, implementation challenges, and future direction of AI-powered technical analysis. It also explains how businesses can evaluate these systems without confusing attractive backtest results with dependable real-world performance.
Research at a glance
- Primary opportunity: More consistent and scalable identification of technical patterns.
- Useful technologies: Machine learning, computer vision, time-series models, and hybrid AI systems.
- Most important limitation: Market patterns change, and historical relationships may not continue.
- Business priority: Measure performance after transaction costs and under different market conditions.
- Recommended approach: Begin with decision support and paper trading before enabling automated execution.
What Is AI in Technical Analysis?
AI in technical analysis refers to the use of machine learning, statistical models, and computer vision to examine financial market data and identify patterns that may be relevant to trading decisions. Traditional technical analysis often relies on manually selected indicators and chart formations. AI-based systems can automate parts of this process, compare many possible signals, and learn relationships that may be difficult to describe using a fixed rule.
For example, a conventional trading strategy might generate a signal when a short-term moving average crosses above a long-term moving average. An AI system could evaluate that crossover alongside recent volatility, trading volume, broader market direction, liquidity, and other conditions. It may learn that the signal historically behaved differently during a strong trend than during a sideways market.
This does not mean that AI knows what a market will do next. It means the system estimates relationships from available data and uses those relationships to support decisions. Its output can be a pattern classification, a probability estimate, a risk score, or a ranking of potential opportunities.
Traditional technical analysis versus AI-powered analysis
| Area | Traditional approach | AI-powered approach |
|---|---|---|
| Pattern detection | Often relies on manual chart reading or fixed rules. | Can classify patterns across large datasets using trained models. |
| Market context | Depends on the trader’s chosen indicators and judgment. | Can combine price, volume, volatility, and other available features. |
| Consistency | Interpretation may vary between traders. | Applies defined model rules consistently, provided the data and system remain reliable. |
| Adaptability | Rules generally need manual adjustment. | Models can be retrained or recalibrated after careful validation. |
| Explainability | Rules are often easy to describe. | Some models are difficult to interpret and need additional explanation tools. |
| Main risk | Human bias and inconsistent execution. | Overfitting, data leakage, model drift, and false confidence. |
Both approaches can be useful. A transparent, well-tested technical rule may be more suitable than a complex neural network when the available data is limited. The correct choice depends on the trading objective, data quality, available computing resources, and evidence of performance outside the training period.
How Automated Pattern Recognition Works
Automated pattern recognition converts market observations into structured inputs that a model can analyze. The system then identifies a pattern or estimates an outcome according to a defined objective. Its quality depends on the full process, not simply on the model selected by the developer.
Why data quality matters more than model complexity
A sophisticated neural network cannot reliably repair an incorrectly constructed dataset. If a model sees a closing price before that price would have been available in real trading, its backtest may appear better than actual performance. Similarly, if historical prices have not been adjusted correctly for stock splits, the model may interpret an administrative price change as a meaningful market pattern.
Developers should establish a clear timestamp policy, preserve the original data source, record all transformations, and make sure that every model input would genuinely have been available at the time a signal was generated. Data preparation must be repeatable so that another researcher can reproduce the same results.
Chart Patterns AI Can Detect
AI systems can work with familiar technical formations, but the exact definitions need to be made measurable. A model should not simply be told to identify a good-looking chart. It needs a consistent representation of the pattern, a defined prediction horizon, and a measurable outcome.
| Pattern or signal | What the system looks for | Potential application |
|---|---|---|
| Head and shoulders | Three swing peaks with a higher central peak and a measurable neckline. | Identify a possible change in trend structure. |
| Double top or bottom | Two comparable price extremes separated by a meaningful pullback or recovery. | Study potential support or resistance failures. |
| Triangles and flags | Converging boundaries, consolidations, and changes in price range. | Monitor possible continuation or breakout conditions. |
| Candlestick formations | Relationships between candle bodies, wicks, gaps, and nearby candles. | Classify short-term price behavior in context. |
| Support and resistance | Repeated reactions around price zones, including the strength and age of each zone. | Measure possible reactions around important price levels. |
| Momentum and volatility | Changes in returns, trading range, volume, and the speed of price movement. | Separate potential trends from unstable or low-activity conditions. |
These formations are hypotheses to test, not universal laws. A breakout may fail because of low liquidity, unexpected news, or a sudden change in market sentiment. A pattern can also look different when observed on a five-minute chart compared with a daily or weekly chart.
For this reason, a strong system should store more than a pattern name. It should record the instrument, timeframe, detection timestamp, pattern boundaries, relevant market conditions, signal confidence, and the subsequent outcome under a predefined evaluation rule.
Six Research Findings and What They Mean
Research into AI-driven technical analysis has grown from simple rule-based testing to machine learning, computer vision, and hybrid forecasting systems. The studies below provide useful evidence, but they investigate different markets, datasets, and outcomes. Their findings should not be treated as directly interchangeable.
Study 1: Charting by Machines
Journal of Financial Economics, 2024
Scott Murray, Yusen Xia, and Houping Xiao examined whether machine learning could forecast the cross-section of stock returns using historical return information visible in price charts. Their study used a model-selection process designed to separate an earlier optimization period from a later testing period.
The researchers reported meaningful predictive relationships in their historical sample, including results that remained present among large-cap stocks. Their analysis also found that nonlinear relationships and interactions contributed to the model’s predictions. This suggests that a machine learning model can extract information from historical price behavior that is not fully captured by a small collection of conventional technical indicators.
Why it matters: AI research should not be limited to recognizing familiar shapes such as triangles or double bottoms. It can also examine more complex relationships across historical price movements.
Important limitation: The paper’s historical results do not guarantee future returns, and its stock-return forecasting task is not identical to detecting individual chart formations.
Study 2: Machine Learning in Stock Market Forecasting: A Comprehensive Review
Discover Computing, published September 2026
This review examines machine learning methods used in stock-market forecasting and brings together research on different modeling approaches. Reviews of this kind are useful because individual experiments can produce very different results depending on the market, the period studied, the input variables, and the evaluation design.
For product teams, the broader lesson is to avoid choosing a model simply because one paper reports an impressive accuracy score. Classification accuracy may not translate into profitable trades, especially when false signals create transaction costs or when the target classes are imbalanced.
Why it matters: Model selection should be based on the business objective, the quality of the evidence, and performance on data that was not used during development.
Practical limitation: A review summarizes existing evidence; it does not establish that one model will work equally well across every asset class or market regime.
Study 3: A Hybrid Framework for Algorithmic Trading
Expert Systems with Applications, published June 2026
Seyed Amir Agah and co-authors presented a Hybrid Candlestick Trend Predictor that combines lightweight neural-network trend forecasting with candlestick pattern recognition. The researchers evaluated the framework on major currency pairs over historical periods ending in June 2025 and included assumptions for spreads and slippage in their reported testing.
The paper reports higher win rates for the hybrid approach than for the standalone candlestick system across its tested currency pairs. This supports a useful design idea: pattern recognition may become more informative when combined with a separate estimate of the broader trend.
Why it matters: Developers can test systems that use one model to describe the broader market direction and another to identify short-term patterns. The components should be evaluated separately as well as together.
Important limitation: Results from a small group of currency pairs do not establish equivalent performance in stocks, crypto assets, or different trading conditions. A win rate alone also does not show average profit, average loss, or maximum drawdown.
Study 4: Combining Technical and Fundamental Analysis
Future Business Journal, published June 2026
This research proposes a hybrid machine learning framework that integrates technical and fundamental analysis for stock-market prediction. Technical data describes market behavior through prices, returns, and trading activity, while fundamental data can provide information about the underlying business and its financial condition.
The central idea is that different information sources may complement each other. A technical formation could be more useful when evaluated alongside company information or other market context, provided the additional data is reliable and available at the time of the decision.
Why it matters: A chart-pattern product for professional investors may offer greater value when it can connect detected formations with broader market or company context instead of showing an isolated label.
Important limitation: Combining more data does not automatically improve performance. Fundamental information must be timestamped correctly, and the model must be tested to determine whether each data source contributes useful out-of-sample information.
Study 5: Deep Learning for Stock Chart Pattern Detection
IEEE conference publication, 2025 research presented in December 2025 and listed in IEEE Xplore in February 2026
This research compares multiple deep learning architectures for classifying continuation patterns using stock data from the Indonesia Stock Exchange. The reported comparison includes artificial neural networks, recurrent neural networks, LSTM, GRU, CNN, and ensemble combinations.
The paper reports very high F1 scores for some combined models in its particular experiment. That is relevant to pattern recognition because precision and recall can provide more detail than overall accuracy when the model must identify a specific formation.
Why it matters: A startup can compare a straightforward baseline with several candidate models rather than assuming that the most complex architecture is the best choice.
Important limitation: Extremely high classification scores deserve careful scrutiny. Developers should verify how labels were created, whether similar windows overlap across training and testing, whether the test period is genuinely independent, and whether results survive a realistic trading backtest.
Study 6: The Case for Caution With AI Trading Bots
Commodity Futures Trading Commission customer advisory
This is a regulatory advisory rather than an academic experiment. The CFTC warns that fraudsters use AI claims to promote trading bots and investment schemes that promise unusually high or guaranteed returns. It describes cases in which misleading automated-trading claims were used to attract investors.
The advisory is important because an AI product can be technically impressive and still be marketed dishonestly. Claims about a model’s accuracy, win rate, or historical return should be backed by transparent evidence, clear assumptions, and a fair explanation of risk.
Why it matters: Businesses building AI-powered financial products need strong reporting, responsible marketing, and clear separation between research signals and promises of investment performance.
What the evidence collectively suggests
Across these sources, three practical lessons stand out. First, machine learning can extract patterns and relationships from historical market data that deserve rigorous testing. Second, hybrid systems that combine trend information, chart patterns, or other market features are promising research directions. Third, high model scores do not remove the need for independent testing, realistic execution assumptions, and risk management.
The evidence does not support a universal claim that AI can reliably forecast every market or produce consistent profits. A responsible implementation should reproduce the relevant research where possible, test it on its own target market, and clearly document any differences in data, methodology, and execution assumptions.
AI Technologies Compared
Different models solve different parts of the problem. A company building an automated pattern-recognition service should choose the simplest architecture that meets its measurable requirements, then compare it against stronger alternatives using the same test design.
| Technology | Best suited for | Main limitation |
|---|---|---|
| Rule-based systems | Clear, interpretable definitions of support, resistance, and indicator crossovers. | Fixed rules may not adapt well to changing market conditions. |
| Random forests and gradient boosting | Structured market features, classification, ranking, and baseline prediction tasks. | Depend on feature design and careful time-aware validation. |
| CNN and computer vision | Image-based chart classification and spatial formations. | Chart scaling, visual design, and label quality can distort results. |
| LSTM and GRU | Sequential price and volume data with temporal relationships. | Can be computationally demanding and still overfit historical sequences. |
| Transformers | Longer sequences and multiple information streams where the data supports the complexity. | May need substantial data and compute, and can be difficult to validate. |
| Hybrid models | Combining trend estimates, pattern detection, market context, and risk filters. | Additional components can make debugging and attribution harder. |
For many early-stage projects, gradient boosting or a well-defined rule-based model is a sensible starting point. It provides a baseline that is easier to inspect and may be sufficient for the task. A CNN can be tested when chart images are genuinely useful, while sequential models may be more appropriate when the underlying time-series structure is central to the prediction.
Large language models can help explain technical concepts, summarize market information, or translate structured signals into readable research notes. However, an LLM should not be treated as a reliable price-prediction engine simply because it can describe a chart fluently. Any financial signal it generates needs an independently defined and tested methodology.
A Practical Trading-System Workflow
Consider a fintech team developing a tool that identifies potential bullish breakouts in liquid stocks. The product is intended to help analysts find candidates, not to promise that every breakout will succeed.
Example: AI-assisted breakout analysis
Market observation: A stock approaches a resistance zone that has been tested several times.
Pattern detector: The model identifies the price structure and checks whether the latest candle closes above the defined zone.
Context filter: The system examines relative volume, recent volatility, broader market direction, and available liquidity data.
Signal assessment: A validated model estimates the likelihood of a predefined outcome over a fixed time horizon. The result is a probability estimate, not a guarantee.
Risk check: The application estimates spread, slippage, potential loss, and the effect of a possible position on total portfolio exposure.
Output: The user receives an alert showing the detected formation, the evidence supporting it, the key risks, and the conditions that would invalidate the signal.
The team should first compare the AI system with a basic breakout rule. If the AI version cannot improve a meaningful metric after costs and on unseen data, the added complexity may not be justified. A more complicated product is not necessarily a better product.
What the user interface should show
A useful interface should help users understand the signal rather than encourage blind reliance on a score. Each alert can include the instrument, timeframe, pattern detected, time of detection, relevant price zone, model confidence if properly calibrated, and a concise explanation of the main supporting features.
- Display the chart with the detected formation clearly marked.
- Show whether the pattern is forming, confirmed, or invalidated under the system’s rules.
- Separate the probability of an event from the estimated financial return.
- Include spread, liquidity, and volatility information when available.
- Record every signal and its later outcome for performance review.
- Make it easy for users to inspect the assumptions and limitations.
For related AICOPSE reading, see AI in Algorithmic Trading and Automated Strategy Execution. For a broader discussion of trading strategy design, explore AI in Stock Market Trading Strategy Development.
How to Evaluate AI Trading Signals
Model evaluation is one of the most important parts of an AI technical-analysis project. A pattern detector can classify charts accurately and still produce poor trading results. This happens because a correct label does not necessarily lead to a favorable price movement, and even a favorable movement may be too small to cover trading costs.
Use more than one performance metric
| Metric | What it measures | Why it matters |
|---|---|---|
| Precision | How often predicted positive cases are correct. | Helps measure the reliability of alerts. |
| Recall | How many actual positive cases the model detects. | Shows how many relevant patterns are missed. |
| F1 score | The harmonic mean of precision and recall. | Useful when both false positives and missed detections matter. |
| Calibration | Whether predicted probabilities correspond to observed frequencies. | Helps users interpret probability estimates appropriately. |
| Net return | Performance after relevant trading costs. | Shows whether the strategy has economic value under the tested assumptions. |
| Maximum drawdown | The largest peak-to-trough decline over the measured period. | Shows the scale of historical downside experienced by the strategy. |
| Sharpe ratio | A measure of excess return relative to return variability. | Helps compare risk-adjusted performance when calculated consistently. |
Build a credible backtesting process
A backtest simulates how a strategy would have performed using historical data. It is valuable, but only when the simulation avoids information that would not have been available at the time and uses reasonable execution assumptions.
- Define the prediction target. Specify the event, time horizon, and criteria that determine whether a prediction is correct.
- Separate training and testing by time. Do not randomly mix future observations into the training data for a time-series prediction task.
- Use walk-forward validation. Train on an earlier period, test on a later period, then move the window forward to assess stability.
- Account for costs. Include fees, spreads, slippage, and any other relevant execution expenses.
- Use realistic order assumptions. Avoid assuming that every trade executes at a historical candle’s ideal price.
- Compare with a baseline. Test against simple technical rules and appropriate passive or market benchmarks.
- Preserve a final holdout period. Avoid repeatedly adjusting the model based on results from the final evaluation set.
- Test different market conditions. Examine trending, sideways, volatile, and stressed periods rather than reporting only the most favorable interval.
Research warning: If a team tests hundreds of patterns, dozens of indicators, and many model configurations, some results may look impressive by chance. Keep a record of experiments, reduce repeated tuning against the same test set, and investigate whether reported performance survives independent evaluation.
Risks, Limitations, and Common Mistakes
Overfitting historical data
Overfitting occurs when a model learns noise or peculiarities of the training sample instead of relationships that generalize. A model may perform exceptionally well on historical charts because it has indirectly learned the labels or outcomes it is supposed to predict. A separate time-based test, disciplined model selection, and careful label construction help reduce this risk.
Data leakage and look-ahead bias
Data leakage occurs when information from outside the permitted prediction window enters the model’s training or evaluation process. For example, a chart pattern may be labeled using a future price movement, but the model input must not include any information from that future movement. The distinction between when a pattern becomes visible and when it can be confirmed must be explicit.
Changing market regimes
Relationships learned in a low-volatility bull market may not work during a sharp sell-off or a period of thin liquidity. Models need monitoring for changes in data distributions, prediction quality, and realized performance. Retraining may help, but it should follow validation rather than occur automatically whenever recent results disappoint.
Transaction costs and liquidity
A signal may identify a small potential price movement that is not large enough to cover spreads, fees, and slippage. This is especially important for high-frequency strategies, illiquid instruments, and strategies that generate many trades. A strategy should be evaluated at a realistic scale and under execution conditions that resemble the intended market.
False confidence from probability scores
A model output of 80 percent should not be interpreted as an 80 percent chance of success unless the probability has been properly defined and calibrated for the relevant task. A confidence score may merely represent the model’s internal classification output. Businesses should document what the score means and test whether predictions at that level occur with the expected frequency.
Image-based chart recognition can mislead
Computer vision models may learn chart colors, axis settings, visual templates, or other presentation details rather than meaningful price behavior. A model may also behave differently when the same chart is displayed at a different scale. Developers should standardize image generation, test alternative visual formats, and compare image-based models with models that use numerical market data directly.
Operational failures
Even a well-tested signal can fail to produce the expected outcome if market data is delayed, an exchange connection fails, an order is rejected, or the system uses an outdated model. Automated execution therefore requires monitoring, error handling, order-state reconciliation, position limits, and a safe process for pausing trading when critical systems malfunction.
Opportunities for Developers, Startups, and Financial Businesses
AI-powered pattern recognition can support several business models. The most suitable opportunity depends on the target customer, the reliability of available market data, the complexity of the product, and the level of financial risk the business is prepared to manage.
Opportunity 1: AI chart-analysis platform
Provide chart annotations, pattern alerts, technical summaries, and historical statistics for traders who want to review more instruments in less time.
Potential revenue model: Subscription plans based on the number of instruments, alerts, and analysis features.
Opportunity 2: Pattern-recognition API
Offer a developer API that accepts normalized market data and returns pattern labels, timestamps, confidence information, and structured metadata.
Potential revenue model: Usage-based pricing, licensed deployments, or business subscriptions.
Opportunity 3: Trading research and backtesting tools
Help quantitative researchers test pattern definitions, compare models, estimate transaction costs, and generate reproducible performance reports.
Potential revenue model: Research subscriptions, team plans, or enterprise licenses.
Opportunity 4: Institutional analytics
Integrate pattern analysis into existing investment research, portfolio monitoring, and risk workflows, with access controls and audit logs.
Potential revenue model: Enterprise contracts, implementation services, and ongoing support.
How to choose the right first product
Start with a specific user problem rather than trying to build a complete autonomous trading platform immediately. A research analyst may need better chart screening, while a broker may want alerts inside an existing interface. A quantitative team may value a backtesting API more than a polished consumer dashboard.
Validate the idea with a narrow asset universe and a small set of measurable patterns. Interview potential users, identify the data sources and licensing requirements, and determine what evidence customers would need before trusting the product. A useful minimum viable product should deliver a repeatable workflow, not simply display AI-generated commentary.
Businesses exploring broader strategy automation can also read AICOPSE’s guide to AI in Algorithmic Trading and Automated Strategy Execution. For market prediction and forecasting context, see AI in Predictive Financial Modeling and Market Forecasting.
Implementation Roadmap and Technology Stack
A practical implementation should move from research to controlled testing and only then to production. The exact timeline depends on market-data access, licensing, model complexity, security requirements, and whether the system will generate alerts or execute trades.
| Phase | Main activities | Expected output |
|---|---|---|
| 1. Define | Select instruments, timeframes, patterns, prediction targets, and intended users. | A documented research specification. |
| 2. Prepare data | Acquire authorized data, validate timestamps, handle missing values, and construct labels. | A reproducible and auditable dataset. |
| 3. Establish a baseline | Implement simple rules and basic statistical or machine learning models. | A benchmark against which more complex models can be tested. |
| 4. Validate | Use time-based tests, walk-forward evaluation, cost assumptions, and robustness checks. | Evidence of performance outside the training period. |
| 5. Pilot | Run paper trading or alert-only deployment and compare expected with observed behavior. | Operational evidence without immediate reliance on live execution. |
| 6. Production | Deploy monitoring, access controls, logging, incident response, and approved execution safeguards. | A controlled and monitored production service. |
Suggested technology stack
- Data processing: Python with pandas or Polars for market-data cleaning and feature engineering.
- Model development: scikit-learn for baselines and tree-based models; PyTorch or TensorFlow for deep learning where justified.
- Storage: PostgreSQL for structured metadata and experiment records, with suitable time-series storage where required.
- Data delivery: Authorized exchange feeds or market-data providers with appropriate usage rights.
- API layer: FastAPI or another well-supported service framework for serving structured model outputs.
- Visualization: A charting library that supports clear annotations, timeframe selection, and historical signal review.
- Monitoring: Centralized logs, service health checks, data-quality alerts, and model-performance dashboards.
- Deployment: Containerized services and a controlled release process, with separate research, testing, and production environments.
These are options rather than mandatory requirements. A small prototype can use a much simpler architecture. The important priorities are reproducibility, secure handling of credentials, data quality, transparent evaluation, and a reliable way to detect when the system stops behaving as expected.
Security, Governance, and Compliance
AI-driven financial analysis requires more than a model that performs well in a notebook. Production systems may handle sensitive account information, paid market data, brokerage credentials, and automated orders. Weak security or unclear accountability can create losses even when the underlying prediction model is sound.
Protect data and trading infrastructure
- Keep API keys, brokerage credentials, and data-provider secrets in a secure secrets manager rather than source code.
- Apply least-privilege access so that research services cannot automatically execute trades unless specifically authorized.
- Encrypt sensitive information in transit and at rest where appropriate.
- Maintain logs of model versions, inputs, generated signals, approvals, and execution events.
- Set position limits, exposure limits, order-rate limits, and emergency stop procedures for systems with execution permissions.
- Use separate testing and production credentials, and verify that a software update cannot accidentally activate live trading.
- Monitor data delays, missing feeds, duplicate events, and unexpected changes in output distributions.
Make the system explainable enough for its users
Not every model needs to expose its entire internal calculation to every customer. However, users should understand what the output represents, which data was used, what assumptions matter, and what limitations apply. For a pattern alert, that may mean showing the relevant price formation and the rules used to confirm it. For an institutional system, it may also mean model documentation, change records, validation evidence, and access to audit trails.
Check legal and regulatory obligations
Requirements vary by jurisdiction, product design, customer type, and whether the business provides general analytics, personalized investment recommendations, portfolio management, or automated order execution. A product offered as a technical-analysis tool may raise different questions from a service that manages customer funds or sends individualized recommendations.
Before launching, obtain appropriate legal and compliance advice for the target market. Review applicable financial-services rules, market-data licenses, consumer-protection obligations, privacy requirements, advertising claims, and recordkeeping duties. A disclaimer alone does not make an otherwise regulated activity exempt from the relevant rules.
Future Predictions for 2027–2030
The following points are informed forecasts based on current research directions and established engineering trends. They are not guaranteed outcomes or claims that a specific capability will arrive on a fixed date.
Prediction 1: Hybrid models will become more practical
More systems are likely to combine interpretable technical rules with machine learning, trend estimates, and market-context features. A layered design makes it easier to compare components and identify whether added complexity actually improves the results.
What businesses should do: Maintain simple benchmarks and require measurable evidence before adding another model.
Prediction 2: Model monitoring will become a competitive advantage
As more organizations adopt similar model architectures, the ability to detect data problems, identify model drift, and respond to changing market conditions may matter as much as the initial prediction method.
What businesses should do: Build performance monitoring and incident response into the first production design rather than adding them after a failure.
Prediction 3: AI explanations will become more important to customers
Traders and institutional users are likely to demand clearer evidence behind automated signals, including the detected formation, relevant market conditions, uncertainty, and historical evaluation results. A score without context is difficult to assess responsibly.
What businesses should do: Design for traceability and useful explanations rather than relying on a single confidence number.
Prediction 4: More products will focus on research workflows
Not every successful financial AI product needs to execute trades. Tools that help analysts screen instruments, test ideas, document evidence, and compare strategies may appeal to organizations that want to retain human approval over investment decisions.
What businesses should do: Explore research APIs, signal review tools, backtesting platforms, and workflow integrations alongside automated trading products.
Prediction 5: Evaluation quality will separate credible products from hype
As AI-generated trading claims become easier to produce, customers will have stronger reasons to look for independently testable results, transparent assumptions, and evidence from periods not used during development. Products that explain limitations honestly may earn more trust than products that advertise extraordinary returns without adequate support.
What businesses should do: Publish clear methodology notes, define metrics precisely, and avoid guarantees about future trading performance.
Prediction 6: Human oversight will remain important for high-impact decisions
Automation can make analysis faster, but financial markets include unexpected events, changing liquidity, and operational risks that historical models cannot fully anticipate. Systems that allow authorized users to inspect, limit, pause, or override automated actions will remain important for many real-world deployments.
What businesses should do: Match the level of automation to the strength of the evidence, the potential consequences of failure, and the control mechanisms available.
Expert Recommendations for Developers and Business Leaders
The recommendations below are a synthesis of the research and implementation considerations discussed in this report. They are practical guidance, not direct quotations attributed to individual researchers.
For developers and quantitative researchers
- Start with a clear target. Define exactly what the model predicts, when the prediction is made, and how the outcome will be measured.
- Build a baseline first. Compare AI with transparent technical rules before investing in expensive architectures.
- Use time-aware validation. Keep future information out of training and preserve a genuinely independent evaluation period.
- Measure economic outcomes. Report precision and recall for detection tasks, then evaluate trading results separately when the product supports trading decisions.
- Test across market conditions. Check whether the model remains useful when volatility, liquidity, or the broader trend changes.
- Keep the research reproducible. Version datasets, features, labels, model configurations, and evaluation scripts.
For startup founders and product managers
- Choose one clear use case. A focused pattern-screening or research tool is easier to validate than an all-in-one autonomous trading platform.
- Validate customer demand early. Confirm that users need the feature and understand what evidence would make them trust it.
- Make limitations visible. Explain uncertainty, historical test assumptions, and the possibility of losses.
- Protect the data supply chain. Confirm licensing, permitted uses, refresh frequency, and provider reliability before building the product around a data feed.
- Design the commercial model around value. Customers may pay for useful screening, workflow savings, or research quality even when a product does not execute trades.
- Keep a controlled launch process. Start with historical testing and paper trading before considering live execution.
For financial institutions
- Assign ownership. Define who approves models, reviews changes, investigates failures, and authorizes production use.
- Integrate with existing controls. Connect signal generation to established risk limits, access management, audit records, and incident response.
- Require independent validation. Model developers should not be the only people responsible for approving performance claims.
- Monitor live behavior. Compare predictions with observed outcomes and investigate significant deterioration.
- Review customer communications. Avoid claims that suggest guaranteed profits or certainty about future market movements.
Frequently Asked Questions
Can AI identify stock chart patterns automatically?
Yes. AI models can be trained to identify formations such as candlestick patterns, triangles, and other chart structures. Performance depends on the quality of the data, how the patterns are defined, the training labels, and whether the model is tested on unseen data.
Is AI technical analysis more accurate than traditional technical analysis?
Not in every situation. AI can process data consistently and detect complex relationships, but it can also overfit, misread unusual market conditions, or generate false signals. A fair comparison requires the same data, target, evaluation period, and realistic assumptions for both approaches.
Which AI model is best for chart pattern recognition?
There is no single best model for every use case. Rule-based methods may be appropriate for clearly defined patterns, tree-based models can work well with structured features, and CNNs may help with image-based classification. Sequential and hybrid models are worth testing when temporal context adds measurable value.
Can AI predict when a stock will rise or fall?
AI can estimate the probability of a defined outcome using historical and current information. It cannot know the future with certainty, and unexpected news or changing market conditions can invalidate historical relationships. Probability estimates should be calibrated and evaluated against independent data.
Does a high accuracy score mean a trading strategy is profitable?
No. Accuracy measures how often predictions are correct under a particular labeling rule. Profitability also depends on the size of gains and losses, trading frequency, transaction costs, execution quality, and the distribution of outcomes. A model can have high accuracy and still lose money.
Can a startup build an AI chart-analysis product without creating its own model?
Yes. A startup can begin with licensed market data, established analytical libraries, existing model-serving tools, and transparent technical rules. It should still validate the complete product and understand the licensing and usage terms of every data source and software component.
Should AI-generated signals automatically place trades?
Not by default. Alert-only deployment and paper trading are useful ways to examine performance before enabling execution. If a business later supports automated orders, it should implement authorization, position limits, execution checks, monitoring, and emergency stop procedures appropriate to its risks and obligations.
What is the biggest risk in AI-powered technical analysis?
One major risk is mistaking historical fit for future reliability. Data leakage, overfitting, changing market conditions, transaction costs, and operational failures can all cause live results to differ from research results. A disciplined evaluation and monitoring process is essential.
Will AI replace human technical analysts?
AI is more likely to automate repetitive screening and support analysis than to remove the need for human judgment in every situation. Human analysts can still contribute domain knowledge, question assumptions, interpret unusual events, and decide how evidence should be used within a broader investment process.
Sources and Further Reading
The following sources support the research discussion and provide additional reading on machine learning, chart-pattern detection, financial forecasting, and responsible trading claims.
- Murray, Scott; Xia, Yusen; Xiao, Houping. “Charting by Machines.” Journal of Financial Economics, 2024. Read the paper.
- Khemka and co-authors. “Machine Learning in Stock Market Forecasting: A Comprehensive Review.” Discover Computing, September 2026. Read the review.
- Agah and co-authors. “A Hybrid Framework for Algorithmic Trading: Combining Lightweight Neural Network Trend Prediction with Candlestick Pattern Recognition.” Expert Systems with Applications, June 2026. Read the paper.
- Abd-Elwahab and co-authors. “A Hybrid Machine Learning Framework Integrating Technical and Fundamental Analysis for Stock Market Prediction.” Future Business Journal, June 2026. Read the paper.
- IEEE conference publication. “Comparative Analysis of Deep Learning Approaches for Stock Chart Pattern Detection in Technical Analysis.” Conference research presented in December 2025. Read the paper.
- Commodity Futures Trading Commission. “Customer Advisory: AI Won’t Turn Trading Bots into Money Machines.” Read the advisory.
Related AICOPSE articles
- AI in Algorithmic Trading and Automated Strategy Execution
- AI in Stock Market Trading Strategy Development
- AI in Predictive Financial Modeling and Market Forecasting
Conclusion
AI is making technical analysis more scalable by helping developers identify chart formations, analyze market sequences, and test relationships that would be difficult to evaluate manually across large datasets. Research on machine learning and hybrid systems offers promising directions, especially when models are compared against simpler approaches and evaluated outside their training periods.
However, the value of AI technical analysis depends on more than the model’s ability to recognize a chart. Data quality, label design, transaction costs, changing market conditions, and reliable execution all influence whether a signal is useful in practice. A high accuracy score or an attractive historical return should never be treated as proof of future profitability.
For developers, the best starting point is a clearly defined use case, a transparent baseline, and a reproducible testing process. For startups, the strongest opportunity may be a focused research or analytics product that solves a real user problem. For financial institutions, monitoring, accountability, security, and risk controls are essential parts of deployment.
The long-term opportunity is to build AI systems that help people understand market behavior more consistently, evaluate evidence more carefully, and make better-informed decisions. The goal should be reliable analysis and responsible use of automation, not the promise of a machine that can predict every market move.
Important Disclaimer
This report is provided for educational and informational purposes only. It does not constitute financial, investment, legal, or tax advice, and it is not a recommendation to buy or sell any financial instrument. AI-generated signals, historical backtests, and research findings do not guarantee future results. Financial markets involve risk, including the potential loss of capital. Readers should conduct their own due diligence and consult appropriately qualified professionals where necessary.
Published by AICOPSE | AI News, Research, Technology, and Industry Insights

Leave a Reply