
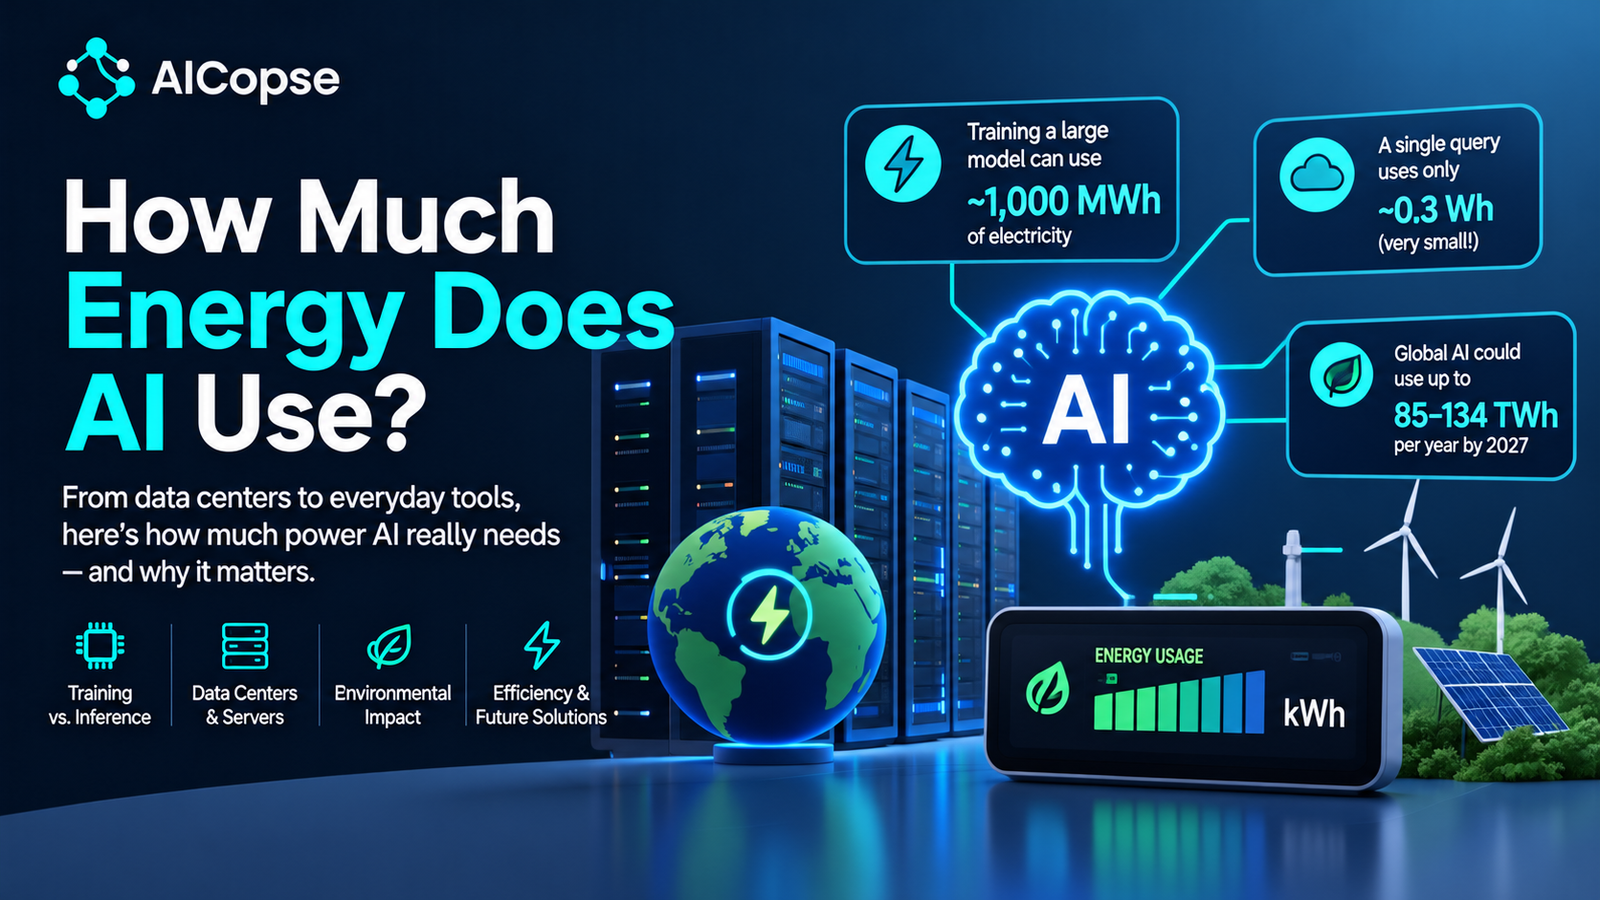
“AI uses as much electricity as a small country” and “a chatbot query is nothing” are both headlines you will see this week, and both are partly true. The confusion comes from mixing three different questions: how much energy one request uses, how much all AI uses, and where that energy comes from. Each has a different answer, and most articles blend them together.
This guide separates them. You will get the current numbers, the physics behind them, a method to calculate your own AI energy use, and an eight-question checklist for judging any AI energy headline.
How This Guide Stays Accurate
AI energy numbers move fast, but the logic behind them does not. So this guide has two kinds of content, and we label them clearly.
The Answer at Three Scales
Both views are correct at the same time. A single request is negligible, while billions of requests, very large training runs and a rapid build-out of data centres add up to something that grids in certain regions already feel.
The Basics: Units and the One Formula
Almost every AI energy calculation uses one formula:
| Unit | Equals | Typically used for |
|---|---|---|
| Watt-hour (Wh) | 1 Wh | One chatbot request |
| Kilowatt-hour (kWh) | 1,000 Wh | A household’s daily use; 1,000 image generations |
| Megawatt-hour (MWh) | 1,000 kWh | Training a small or older model |
| Gigawatt-hour (GWh) | 1,000 MWh | Training a large model; one big data centre per day |
| Terawatt-hour (TWh) | 1,000 GWh | A country’s or the world’s yearly electricity |
Watts versus watt-hours: a watt is a rate (how fast energy is used), while a watt-hour is an amount (how much was used). Many headlines mix them up, so check which one a number refers to.
Where AI’s Energy Goes
AI energy use has three parts, and it helps to keep them separate:
- Training: building a model. It is a huge one-time (or occasional) cost per model.
- Inference: running the model every time someone uses it. It is small per request but repeated billions of times.
- Overhead: everything that keeps the machines running, including cooling, power conversion and idle spare capacity.
Training versus inference
Companies rarely publish training energy, but from the estimates that exist, analysts conclude that total demand is dominated by inference, not training. Epoch AI estimates that training Grok 4 used about 0.31 TWh, which is only around 0.2% of the roughly 155 TWh used by AI-focused data centres in 2025. The more people use AI, the more inference dominates.
Training is still growing fast
Training GPT-3 was estimated at about 1,287 MWh in a 2021 analysis by Google and Berkeley researchers. Epoch AI’s estimate for Grok 4 is about 310,000 MWh, roughly 240 times larger. The two numbers come from different estimators, so treat the ratio as an order of magnitude, but the direction is clear: frontier training runs have grown by hundreds of times.
Where the electricity goes inside a data centre
Google published a full breakdown for serving its Gemini model in 2025. Counting only the active AI chips understates the footprint:
Snapshot: Google’s disclosure for Gemini, 2025. Other providers’ splits will differ.
PUE explained: data centres report a number called power usage effectiveness (PUE), the total electricity used divided by the electricity used by the computers alone. A PUE of 1.5 means that for every 1 kWh of computing, another 0.5 kWh goes to cooling, lighting and losses. The closer to 1.0, the more efficient the facility.
Energy per Request, by Type
The single most important idea for personal and business use is this: the type of request matters far more than the number of requests. A quick text question and a long reasoning task are very different workloads.
| Type of request (snapshot, 2025–2026) | Energy per request | Source |
|---|---|---|
| Median text prompt, Gemini | 0.24 Wh | Google, 2025 |
| Average ChatGPT query | About 0.34 Wh | OpenAI’s CEO, 2025 (no breakdown given) |
| Typical ChatGPT query | About 0.3 Wh | Epoch AI, independent estimate |
| Long query (about 7,500 words of input) | About 2.5 Wh | Epoch AI |
| Very long query (about 75,000 words) | About 40 Wh | Epoch AI |
| Standard AI agent request (chips only) | About 1.1 Wh | IEA, 2026 |
| Agent request with reasoning (chips only) | About 50 Wh | IEA, 2026 |
The IEA’s agent figures count GPU electricity only, so the full footprint including overhead is higher. Notice the spread: from about 0.3 Wh to about 50 Wh, a factor of roughly 150, depending only on what you ask the AI to do.
What a small number looks like
Google compared its 0.24 Wh median prompt to watching television for less than nine seconds, and Our World in Data compares it to a microwave running for under one second. The average person in the European Union uses about 17 kWh of electricity a day across the whole economy, which equals about 70,800 prompts at 0.24 Wh, or about 6,800 long 2.5 Wh queries.
Calculate Your Own AI Energy Use
You can estimate energy and carbon for any usage with three inputs: how many requests you make, the energy per request, and the carbon intensity of the grid. The example below assumes 20 requests a day for a year. Swap in the newest numbers whenever they change; the method stays the same.
EU_DAILY_KWH = 17   # average electricity use per person per day in the EU
per_query_wh = {
    "Median text prompt (Google, 2025)":      0.24,
    "Average ChatGPT query (OpenAI, 2025)":   0.34,
    "Long input, ~7,500 words (Epoch AI)":    2.5,
    "AI agent request (IEA, 2026)":           1.1,
    "Agent request with reasoning (IEA)":     50,
    "Very long input, ~75,000 words (Epoch)": 40,
}
queries_per_day = 20
for name, wh in per_query_wh.items():
    daily_wh = wh * queries_per_day
    yearly_kwh = daily_wh * 365 / 1000
    share = daily_wh / (EU_DAILY_KWH * 1000) * 100
    print(f"{name:42} {daily_wh:7.1f} Wh/day  {yearly_kwh:8.1f} kWh/yr  {share:6.3f}% of EU daily use")

# Carbon = energy x grid intensity (IPCC lifecycle medians, g CO2e per kWh)
grids = {"Coal": 820, "Gas": 490, "Solar PV": 48, "Nuclear": 12}
yearly_kwh = 0.34 * queries_per_day * 365 / 1000
for g, intensity in grids.items():
    print(f"{g:9} {yearly_kwh * intensity:8.0f} g CO2e")
Real output of the code:
| 20 requests a day, for one year | Per day | Per year | Share of one EU person’s daily electricity |
|---|---|---|---|
| Median text prompt (0.24 Wh) | 4.8 Wh | 1.8 kWh | 0.028% |
| Average ChatGPT query (0.34 Wh) | 6.8 Wh | 2.5 kWh | 0.040% |
| Standard agent request (1.1 Wh) | 22 Wh | 8.0 kWh | 0.129% |
| Long input (2.5 Wh) | 50 Wh | 18.2 kWh | 0.294% |
| Very long input (40 Wh) | 800 Wh | 292 kWh | 4.7% |
| Agent request with reasoning (50 Wh) | 1,000 Wh | 365 kWh | 5.9% |
The same numbers as a picture (annual kWh, linear scale):
The lesson: twenty ordinary chats a day is a rounding error, but twenty heavy reasoning or long-document requests a day is a measurable slice of a person’s electricity. Agents that run many steps on your behalf push usage toward the heavy end without you noticing.
Images and Video
Image generation uses more energy than text. In a 2023 study, researcher Sasha Luccioni and colleagues measured the median image-generation model at about 1.35 kWh per 1,000 images, against about 0.04 kWh per 1,000 text generations, with the least efficient image model reaching 11.49 kWh per 1,000 images, nearly a full smartphone charge per image.
The most useful lesson is about measurement. The same image model (Stable Diffusion XL) was reported at 11.41 kWh per 1,000 images in that study and at 1.64 kWh in the AI Energy Score project. The difference came from image size and hardware: the 2023 study used default, larger images, and the AI Energy Score fixed the image dimensions. One model, a sevenfold difference, depending on settings. Video is more energy-intensive per task still, but there is little solid data on per-video energy or total volumes.
How Much Electricity All AI Uses
| Measure (snapshot, IEA 2026) | 2025 | 2030 base case |
|---|---|---|
| All data centres | 485 TWh (1.5% of world electricity) | 945 TWh (about 3%) |
| AI-focused data centres | 155 TWh (about 0.5%) | 465 TWh |
| Other data centres (email, streaming, banking, cloud) | 330 TWh | 480 TWh |
| AI’s share of all energy | About 0.1% of primary energy (electricity is about one-fifth of primary energy) | Not estimated here |
Data centres are not the same as AI. Most data-centre electricity in 2025 (about two-thirds) still served ordinary digital services. This is the most common error in articles on the topic, which often quote the data-centre total as if it were AI alone. The IEA’s base case has AI-focused centres matching the rest by 2030.
Why two sources can differ by 60%
The Energy Institute, using S&P Global data, puts 2025 data-centre demand at about 790 TWh (2.5% of world electricity), around 60% above the IEA’s 485 TWh. About two-thirds of the gap is cryptocurrency mining, which the Energy Institute includes (roughly 150 to 200 TWh) and the IEA excludes. The rest comes from different methods: S&P builds from installed capacity and assumed utilisation, while the IEA estimates the electricity of the equipment directly. When two numbers disagree, check what each one counts.
Why It Matters Locally
A global share of 1.5% sounds small, but demand is geographically concentrated. About 5% of US electricity goes to data centres, and probably around 2% to AI-focused ones. In Ireland, data centres use more than 20% of the country’s electricity, and in several US states more than 10%, with Virginia above 25%. The IEA notes that nearly half of US data-centre capacity sits in five regional clusters.
That is why the real stress test is not the world total. It is whether particular grids can add generation and transmission fast enough while keeping prices and emissions under control.
Carbon: It Depends on the Grid
Energy and emissions are different things. The same kilowatt-hour can emit a hundred times more carbon on one grid than another. The IPCC’s lifecycle medians (which include building and fuelling each source) show the range:
| Electricity source | Lifecycle emissions (g CO2e per kWh, IPCC median) |
|---|---|
| Coal | 820 |
| Natural gas (combined cycle) | 490 |
| Solar PV (utility scale) | 48 |
| Hydropower | 24 |
| Nuclear | 12 |
| Wind (onshore / offshore) | 11 / 12 |
Applying this to the calculator: 20 average ChatGPT queries a day for a year (2.48 kWh) produce about 2,035 g of CO2e on a coal-based grid, 1,216 g on gas, 119 g on solar and 30 g on nuclear. The same usage differs by about 70 times depending on where the electricity comes from. For climate impact, how electricity is generated can matter more than how much is used.
Water Use
Data centres use water mainly for cooling and, indirectly, through the power plants that supply them. Google’s 2025 disclosure puts a median Gemini text prompt at about 0.26 millilitres of water, roughly five drops, and 0.03 grams of CO2e. Water use varies enormously with local climate, cooling design and the power mix, and it is a local issue far more than a global one, for the same reason as electricity.
Why Estimates Differ So Much
You will see numbers for a “ChatGPT query” ranging from under 0.3 Wh to several watt-hours. Most of the variation comes from six sources:
| Source of difference | Example |
|---|---|
| System boundary | Google’s median prompt is 0.10 Wh counting only active chips and 0.24 Wh counting the full serving stack, a 2.4 times difference from the same prompt. |
| Median versus average | Most prompts are short, so the median is small. Rare very long requests pull the average up. |
| Type and length of request | From about 0.3 Wh to about 50 Wh in the table above. |
| Hardware and settings | One image model measured at 11.41 versus 1.64 kWh per 1,000 images. |
| Measured versus estimated | Company figures come from real fleets; outside estimates guess at hardware and utilisation. |
| Date | Google reported that its median prompt used 33 times more energy in May 2024 than in May 2025, so an older number can be wildly out of date. |
That last row explains a stubborn myth. Some reports, including a Schneider Electric analysis cited by IEEE Spectrum, still use about 2.9 Wh per query, roughly ten times the figures companies reported in 2025. Claims that AI uses “ten times a Google search” rest on that older number against a search estimate of about 0.3 Wh. The 2025 company-reported medians sit close to that old search figure.
An 8-Question Checklist for Any AI Energy Headline
New AI energy numbers will keep appearing long after this guide. Use these questions on every one of them:
| Ask | Why it matters |
|---|---|
| 1. Is it AI or all data centres? | Data centres also run email, streaming and banking. Quoting the whole total as “AI” overstates it by about threefold. |
| 2. Electricity or total energy? | Electricity is only about a fifth of primary energy, so shares look very different. |
| 3. Training, inference or both? | A big training number is one-off; inference repeats. |
| 4. Measured or estimated? | Who measured it, on what hardware, and is the method published? |
| 5. Median or average? What kind of request? | A short prompt and a reasoning task differ by up to 150 times. |
| 6. What is inside the boundary? | Chips only, or cooling, idle capacity and host machines too? Does it include crypto mining? |
| 7. Which year and which grid? | Efficiency changes quickly, and carbon depends on where the power comes from. |
| 8. Is it a projection, and what does it assume? | Forecasts depend on assumed demand and efficiency; the IEA itself publishes four scenarios. |
Will AI’s Energy Use Keep Growing?
Total AI energy use is the product of two opposing forces: how much AI is used, and how much energy each use takes.
| Pushing energy use up | Pushing energy use down |
|---|---|
| Rapid adoption by more people and companies | More efficient chips and software; Google reported a 33-times drop in energy per median prompt in a year |
| Heavier requests: agents, reasoning, long documents, images and video | Routing simple tasks to smaller models and better workflow management |
| Ever larger training runs | Better utilisation of idle capacity and cooling |
| Efficiency making AI cheaper, which increases use (the rebound effect) | Cleaner grids, which cut carbon even when energy rises |
Forecasts are uncertain, and the IEA’s own base case is regarded by some analysts as conservative about AI demand. One research team studying inference notes that earlier projections of digital energy use repeatedly overestimated demand because they underestimated efficiency gains, while also pointing out that the strain on grids comes mainly from training loads, the pace of adoption and concentrated build-outs.
Our read: total AI electricity use will keep rising, while energy per task keeps falling, and the headline depends on which trend wins in a given year. So always track two numbers separately: total terawatt-hours (what grids feel) and watt-hours per task (what efficiency shows). Either number alone tells a misleading story.
What You Can Do
| Who | Practical steps |
|---|---|
| Everyday users | Use simple prompts for simple tasks, avoid regenerating images or video repeatedly, and reserve reasoning modes and very long documents for jobs that need them. For your personal footprint, travel and heating usually matter far more than chatbot use. |
| Businesses | Route easy tasks to smaller models, cache repeated answers, track tokens and cost per task, ask vendors for energy-per-request data, and pick cloud regions with cleaner grids. |
| Developers | Right-size the model to the task, shorten prompts and outputs, batch work, and measure energy and carbon in testing. The AI Energy Score project benchmarks energy by task, which helps compare models. |
| Policymakers and planners | Plan for local grid concentration, require transparent per-task and total reporting, and pair demand growth with new clean supply. |
Common Myths About AI Energy Use
| Myth | Reality |
|---|---|
| “Data centres use as much as AI.” | Data centres also run everything else digital. AI-focused ones were about a third of the total in 2025. |
| “A ChatGPT query uses 10 times a Google search.” | That comes from an older estimate. 2025 company medians are close to the old search figure. |
| “AI energy is mostly training.” | Analysts conclude inference dominates the total, and the gap widens as usage grows. |
| “One chatbot request is harmless, so AI has no energy problem.” | Per-request energy is small, but billions of requests, heavy workloads and local grid concentration add up. |
| “All AI requests cost about the same.” | They span roughly 150 times, from a quick prompt to a reasoning agent task. |
| “Using less energy means less carbon.” | Carbon depends on the grid, and the same kWh can differ by about 70 times. |
| “Everyone agrees on the numbers.” | Two respected sources differ by about 60% on 2025 data-centre demand because they count different things. |
Mini Glossary
- Watt-hour (Wh): an amount of energy; one watt used for one hour.
- TWh: terawatt-hour, one billion kilowatt-hours; used for national and global totals.
- Inference: running a trained AI model to answer a request.
- Training: the process of building an AI model from data.
- PUE (power usage effectiveness): total data-centre energy divided by the energy used by the computers; closer to 1.0 is better.
- Grid carbon intensity: grams of CO2-equivalent emitted per kilowatt-hour of electricity.
- gCO2e: grams of carbon dioxide equivalent, a common unit for combined greenhouse-gas impact.
- Rebound effect: when efficiency lowers the cost of something, so people use more of it.
Frequently Asked Questions About AI Energy Use
How much energy does one ChatGPT query use?
OpenAI’s CEO said an average query uses about 0.34 Wh in 2025, and independent estimates from Epoch AI put a typical query at about 0.3 Wh. Long or reasoning-heavy requests use much more, from about 2.5 Wh up to tens of watt-hours.
How much electricity does AI use worldwide?
The IEA estimates that AI-focused data centres used about 155 TWh in 2025, around 0.5% of world electricity, out of 485 TWh for all data centres (1.5%). Its base case projects 945 TWh for all data centres by 2030, with AI-focused ones about half.
Does AI use more energy than a Google search?
Older estimates said ten times more. Company-reported 2025 medians of 0.24 to 0.34 Wh are close to the long-quoted search figure of about 0.3 Wh, though heavier AI tasks use far more than either.
How much energy does it take to train an AI model?
Training GPT-3 was estimated at about 1,287 MWh. Epoch AI estimates about 0.31 TWh for Grok 4. Training is a large one-off cost per model, but analysts conclude that inference accounts for most of AI’s total energy.
How much energy does AI image generation use?
Much more than text: a 2023 study measured a median of about 1.35 kWh per 1,000 images, ranging up to 11.49 kWh for the least efficient model. Results depend heavily on image size and hardware.
Is AI bad for the climate?
The electricity is small at global scale (about 0.5% of the world’s total in 2025), but growing quickly and concentrated in a few grids. The carbon impact depends mostly on how that electricity is generated, which can change emissions by about 70 times for the same energy.
How much water does AI use?
Google estimates about 0.26 millilitres per median Gemini prompt. Water use varies greatly by location and cooling method and is mainly a local concern.
What is the difference between data centre and AI energy use?
Data centres host all digital services. AI-focused data centres were about a third of data-centre electricity in 2025. Many articles wrongly report the data-centre total as AI’s total.
Will AI energy use keep rising?
Total use is projected to rise, while energy per task has been falling fast. Forecasts differ widely, so watch total terawatt-hours and watt-hours per task separately.
How can I reduce my AI energy use?
Match the request to the task, avoid repeatedly regenerating images and video, and use reasoning modes and very long documents only when needed. Your own chatbot use is small compared with travel and heating, so prioritise accordingly.
Key Takeaways
- Energy equals power times time, and carbon equals energy times grid intensity. These two formulas let you check any claim.
- A typical text prompt uses about 0.24 to 0.34 Wh, while heavy requests use up to about 150 times more.
- AI-focused data centres used about 155 TWh in 2025, around 0.5% of world electricity; all data centres used 485 TWh (1.5%).
- Inference dominates total AI energy, even though frontier training runs have grown by hundreds of times.
- Demand is concentrated: some grids, such as Ireland and Virginia, feel it strongly.
- Carbon depends on the grid, and the same usage can differ by about 70 times between coal and nuclear or wind.
- Always ask what a number includes: AI or all data centres, chips only or the full stack, median or average, which year.
We refresh the dated snapshot tables as new measurements are published, while the method stays the same. Bookmark this page, and follow the AICopse AI Updates section and the AICopse homepage for daily AI coverage.
Sources and further reading:
- Our World in Data (Hannah Ritchie, July 2026): How much energy do data centers and artificial intelligence use?
- International Energy Agency (2026): Key Questions on Energy and AI
- Google Cloud: Measuring the environmental impact of AI inference (2025)
- EnergySage: Google’s per-prompt energy breakdown
- Epoch AI: How much energy does ChatGPT use?
- Epoch AI: Grok 4 training resources
- Sam Altman: The Gentle Singularity (2025)
- Luccioni et al.: Power Hungry Processing, Watts Driving the Cost of AI Deployment? (2023)
- AI Energy Score: why measured image-generation energy differs between studies
- IEEE Spectrum: How much energy does it take to power billions of AI queries?
- arXiv: Energy use of AI inference, efficiency pathways and test-time scaling
- Life-cycle greenhouse gas emissions of energy sources (IPCC 2014 medians)
- Communications of the ACM: Energy cost of training and using language models (GPT-3 estimate)

Leave a Reply