
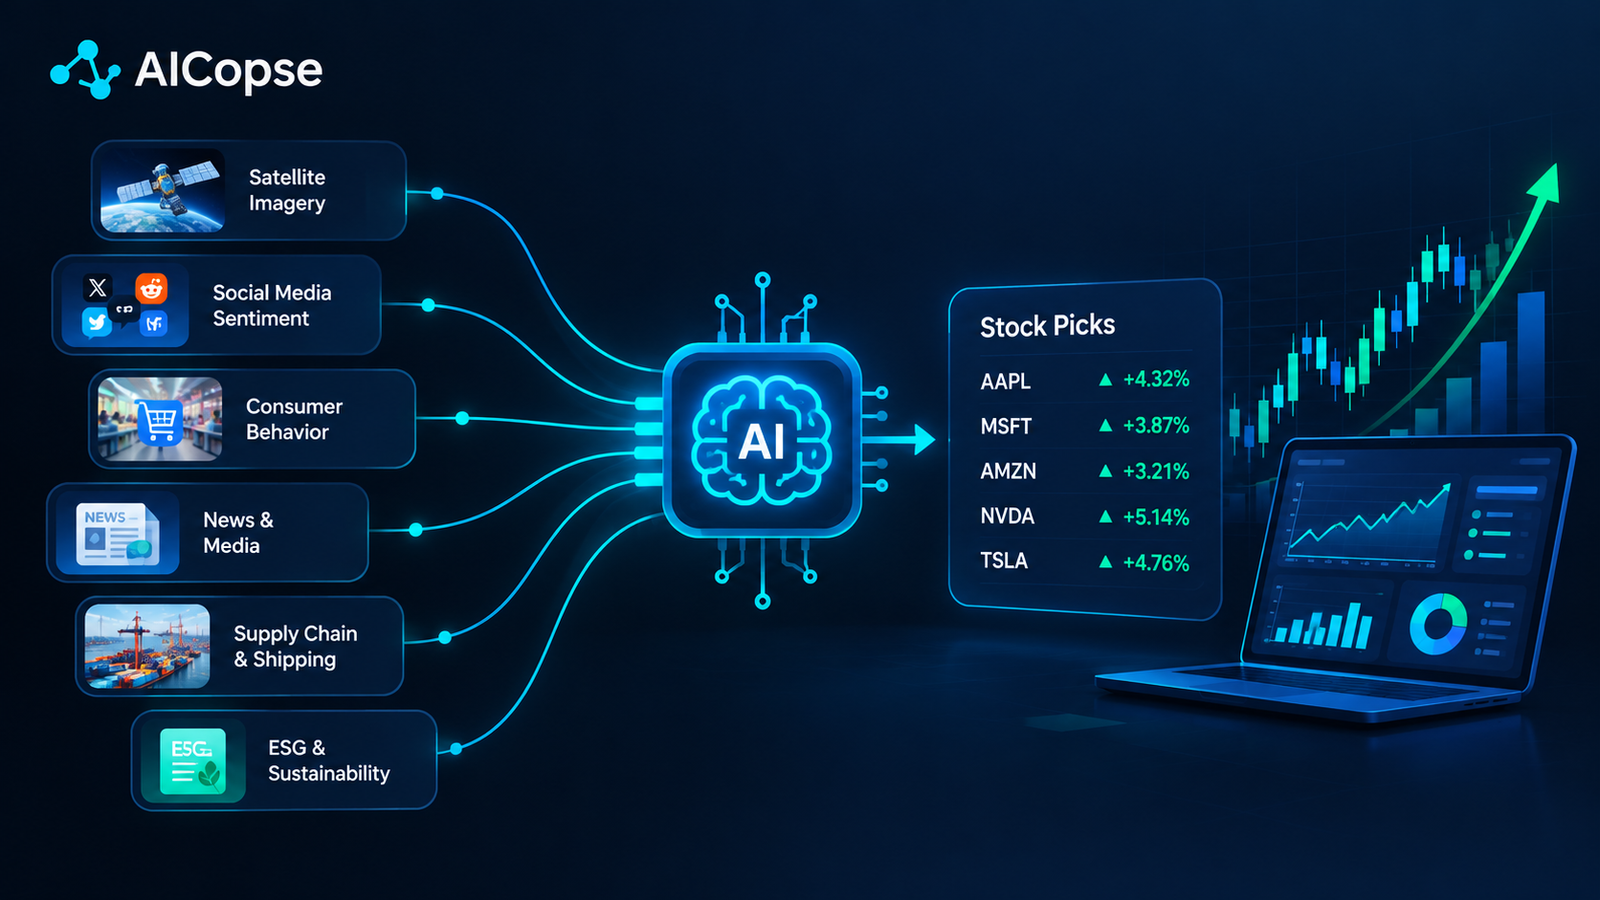
AI, Quantitative Finance and Investment Research
AI in Alternative Data Mining for Stock Picking: Research, Strategies, Risks and the Future
How artificial intelligence helps investors turn satellite imagery, consumer spending, web activity, search trends, supply-chain signals and other nontraditional datasets into better-informed stock selection decisions.
AI Stock Picking
Quantitative Investing
Financial Machine Learning
Executive Summary
Stock investors traditionally study company earnings, balance sheets, valuation ratios, analyst estimates and economic indicators. These sources remain essential, but they do not always reveal business changes as quickly as investors would like. Alternative data can provide additional evidence about what customers are buying, whether a retailer is attracting visitors, how a product is being received, whether a supplier is facing delays or whether interest in a company is growing.
Artificial intelligence makes these datasets easier to process at scale. Machine learning can identify unusual patterns, natural language processing can interpret reviews and discussions, computer vision can measure activity in satellite images, and time-series models can combine these signals with traditional financial data. The goal is to estimate business performance or future returns more effectively, not to predict every price movement.
The main conclusion: AI-powered alternative data mining is most useful when it tests a specific investment question, uses data available at the time of the decision, and improves out-of-sample results after costs. A large dataset, an advanced model or a convincing backtest is not proof of a profitable investment strategy.
What Is AI in Alternative Data Mining for Stock Picking?
Alternative data refers to information that investors use alongside traditional financial and market data. It may come from digital platforms, business transactions, online activity, sensors, satellite images, shipping records, job postings, customer feedback or other sources that reveal something about a company’s operations, customers or competitive position.
AI-powered alternative data mining is the process of collecting, cleaning, interpreting and combining these sources with artificial intelligence and statistical methods to generate evidence for stock selection. Instead of relying only on a company’s quarterly report, an investor might study changes in its web traffic, customer spending, product reviews, employee hiring or supply-chain activity to form an independent estimate of future revenue, margins or business risk.
For example, a retailer may report quarterly sales only after the quarter has ended. Properly licensed and representative payment data could provide an earlier indication of consumer spending. AI can compare that spending with historical patterns, seasonal effects, regional differences and competitor performance. An analyst can then assess whether the signal supports or challenges the market’s current expectations.
Important distinction: A signal that predicts higher sales does not automatically predict a higher stock return. The market may already expect strong sales, the company’s valuation may be too high, or the additional revenue may come with lower margins. Stock picking requires connecting alternative data to expectations, valuation, risk and the price already paid for the investment.
Why Alternative Data Matters for Stock Selection
Public markets process enormous amounts of information. By the time a company releases its earnings, analysts and investors may already have formed expectations using public news, industry surveys, competitor disclosures and proprietary datasets. Alternative data can help investors identify business developments earlier, test market assumptions and investigate companies whose operations are difficult to assess through traditional reports alone.
A review published in Financial Innovation in December 2024 examined more than 100 papers on alternative data in finance and business. It describes applications involving investment prediction, risk management, consumer behavior and business performance. Its broader message is that nontraditional data can provide additional information, but the value depends on the source, the problem being studied and how the information is interpreted.
For stock pickers, alternative data can help answer five practical questions:
- Is demand improving? Customer spending, product reviews, search activity and web visits can provide clues about demand before reported results arrive.
- Are market expectations realistic? Independent estimates of business activity can be compared with analyst forecasts and valuation assumptions.
- Is a competitive position changing? Product launches, customer complaints, hiring trends and competitor activity can help reveal shifts in market share or business momentum.
- Are risks building? Supply-chain delays, falling customer engagement, negative reviews or unusual operational patterns may flag problems requiring further investigation.
- Which companies deserve deeper research? AI can screen thousands of companies and rank those with unusual changes in demand, attention, operations or financial expectations.
Types of Alternative Data Used for AI Stock Picking
Not every dataset is equally useful for every industry. Consumer spending can be especially relevant for retailers, while vessel tracking may be more useful for shipping and commodities. Job postings may reveal expansion plans, but they are less direct than actual sales or cash flow. Investors should begin with the business question and then choose the data that can reasonably answer it.
| Data category | Possible signal | Relevant businesses | Main limitation |
|---|---|---|---|
| Consumer spending | Changes in transaction volume, basket size or spending trends | Retail, restaurants, travel, consumer goods | Sample coverage, category mapping and seasonal bias |
| Web and app activity | Product interest, traffic growth, engagement and digital demand | E-commerce, software, travel, digital platforms | Bots, tracking changes and weak links to actual purchases |
| Satellite and geospatial data | Parking activity, facility use, crop conditions or infrastructure changes | Retail, agriculture, energy, shipping, industrials | Weather, image resolution, revisit frequency and interpretation errors |
| Search and social activity | Investor attention, customer interest and changes in sentiment | Consumer brands, technology, entertainment, highly discussed stocks | Noise, manipulation, bots and ambiguous search terms |
| Hiring and employee data | Hiring acceleration, skill demand, restructuring or talent movement | Software, AI, healthcare, manufacturing | Duplicate listings, delayed updates and unclear hiring outcomes |
| Supply-chain and shipping data | Delivery delays, inventory movement, port congestion or trade flows | Semiconductors, automotive, industrials, energy, commodities | Indirect relationships and difficulty attributing activity to a company |
| Customer reviews and product data | Product satisfaction, pricing changes, demand shifts and possible churn | Retail, software, travel, consumer services | Review manipulation, platform bias and nonrepresentative customers |
These categories often become more useful when combined. Rising web traffic alone may indicate curiosity rather than revenue. If traffic growth appears alongside higher transaction activity, stronger customer reviews and improving product availability, the combined evidence may be more informative. It still requires validation against company fundamentals and market expectations.
How AI Converts Raw Data Into a Stock-Picking Signal
Raw alternative data is rarely ready for investment decisions. It can contain duplicates, incomplete records, changes in collection methods, misleading identifiers and information that arrives too late. A dependable system needs a repeatable process from collection through evaluation.
The alternative data mining workflow
1. Define the investment question
Example: Can changes in online demand help estimate a retailer’s next-quarter revenue surprise?
2. Acquire and validate data
Check licensing, source coverage, update frequency, historical availability and collection timestamps.
3. Clean, map and transform
Remove duplicates, map records to companies, adjust for seasonality and create meaningful features.
4. Model and compare
Test statistical baselines, machine learning models and combined fundamental-data models.
5. Validate in time order
Use walk-forward testing, point-in-time data and realistic transaction costs to assess performance.
6. Generate a monitored research signal
Produce a ranked watchlist, confidence estimate, supporting evidence and risk flags for review.
Illustrative workflow. Actual system design depends on the asset universe, investment horizon, data access and regulatory requirements.
The AI techniques behind the process
- Supervised machine learning: Random forests, gradient-boosted trees and regularized regression can estimate outcomes such as sales surprises, earnings revisions or relative stock returns using historical features.
- Natural language processing: Language models can classify product reviews, public discussions, job descriptions and news into themes such as demand, customer satisfaction, supply risk or competitive pressure.
- Computer vision: Image models can classify vehicles, estimate activity at selected sites or detect changes in infrastructure, subject to image quality and validation.
- Time-series models: Statistical and deep learning models can study trends, seasonality, lagged relationships and changes in how signals behave over time.
- Graph analytics: Graph models can connect suppliers, customers, products and companies. They may help investigate how a disruption at one business could affect other businesses in its network.
- Anomaly detection: Models can flag unusual activity, such as a sudden drop in app engagement or an unexpected change in shipping volume, for further investigation.
More complex models are not automatically better. A simple regression that consistently estimates revenue surprises may be more valuable than a deep learning system that performs well only on a narrow historical sample. Model selection should follow evidence from out-of-sample testing, not the popularity of a technique.
Six Research Studies That Explain the Potential and Limits
The research below covers broad reviews, satellite imagery, investor attention and social-media signals. These papers do not all test the same outcome. Some examine forecasting, others study investor behavior or the usefulness of a particular data source. Their findings should therefore be compared carefully rather than treated as one universal proof that alternative data produces excess returns.
Study 1 · Broad evidence review
Alternative Data in Finance and Business: Emerging Applications and Theory Analysis
Published: December 2, 2024, in Financial Innovation.
This open-access review examines more than 100 research papers published between 2015 and 2023. It organizes alternative data into broad categories that include behavioral information, commercial activity and sensor-based observations. Examples include social-media activity, search trends, consumer transactions, web activity and satellite imagery.
What the study contributes: The review shows why alternative data can help investors understand business activity that traditional financial statements may reveal only later. Consumer spending can help assess demand, web activity can provide a view of online interest, and satellite data can offer indirect information about physical operations.
How stock pickers can use the finding: Build an industry-specific data map before buying datasets. For retailers, transaction and product-demand information may be relevant. For shipping or industrial companies, logistics and physical activity may be more suitable. The best dataset is the one that measures a meaningful driver of the company’s business.
Important limitation: A review of many studies is not proof that every data source predicts returns or that every signal remains profitable after it becomes widely available. The results depend on study design, data access and the investment horizon.
Study 2 · Forecasting horizons
Does Alternative Data Improve Financial Forecasting? The Horizon Effect
Published: March 7, 2024, in The Journal of Finance.
Dessaint, Foucault and Frésard investigate how alternative data affects financial forecasting at different time horizons. Their paper argues that data designed to reveal current customer interest or business activity may be especially useful for near-term forecasts. It also finds that greater attention to short-term information can reduce the relative informativeness of longer-term forecasts.
Why this matters: An increase in product searches or customer transactions may help estimate sales over the next reporting period. It is much harder to conclude that the same signal predicts a company’s competitive position, cash flows or stock returns several years later.
Practical application: Match each dataset to a defined forecasting horizon. Use high-frequency demand signals for short-term operating estimates, then combine them with industry structure, balance-sheet strength, margins and valuation for longer-term stock selection.
Limitation: A short-term forecasting improvement does not guarantee a profitable trading strategy. Investors must still account for the time when the data became available, the market’s expectations and trading costs.
Study 3 · Satellite imagery
Institutional Trading and Satellite Data
Published: January 2025, in Finance Research Letters.
This study investigates whether access to satellite coverage of major retailers changes the ability of institutional investors to time their trades. Its reported findings indicate that satellite data availability improves the return predictability of daily institutional trading. The effect is stronger among companies with greater information asymmetry, and the authors attribute the result primarily to non-hedge-fund institutions.
Why it matters: A satellite image can provide an indirect view of activity at physical locations. For a retailer, changes in parking-lot occupancy may help researchers investigate store traffic. For other industries, geospatial observations can potentially reveal changes in construction, agriculture, logistics or industrial activity.
Practical application: Combine image-derived activity measures with store locations, holidays, weather, local events and historical sales patterns. A vehicle count is only a proxy for customer activity, so a robust model must test whether the proxy has a stable relationship with the business outcome.
Limitation: The result is context-specific. Satellite coverage, image frequency, cloud conditions, store format and geographic differences can all affect accuracy. The study does not prove that every investor can obtain a durable advantage from satellite data.
Study 4 · Search behavior and measurement error
Measuring Investor Attention Using Google Search
Publication: Management Science, published online in 2024 and appearing in volume 71, issue 7.
DeHaan, Lawrence and Litjins examine search-volume measures used as proxies for investor attention. Their analysis uses a dataset containing 2.7 billion website visits following searches for S&P 500 company tickers. The researchers report that 69 percent of the searches they studied were unrelated to investing.
Why this is important: A ticker can also be a common word, abbreviation or reference unrelated to a stock. A model that interprets all ticker searches as investment interest may mistake noise for a useful signal.
Practical application: Improve the query definition by including terms such as the company name or the word “stock”, and test whether the resulting measure better reflects investment-related searches. The study recommends a ticker-plus-stock approach as a better-specified measure in many settings.
Limitation: Better measurement does not automatically produce better returns. Search activity can reflect breaking news, product launches, controversy or general curiosity. It should be interpreted alongside other evidence.
Study 5 · Social sentiment
What’s Trending? Stock-Level Investor Sentiment and Returns
Published: August 28, 2025, in the International Journal of Financial Studies.
This study examines a stock-level investor sentiment measure built from social media. The authors distinguish sentiment linked to company fundamentals from a non-fundamental component. Their results suggest that the non-fundamental component is particularly relevant to short-term return patterns and subsequent reversals, with stronger effects among smaller, younger and harder-to-value companies.
Why it matters: Online enthusiasm may influence investor behavior even when it does not correspond to an equivalent change in company earnings or cash flow. This can create opportunities for researchers studying attention, disagreement and sentiment-driven price movements.
Practical application: Use language models to separate discussion of measurable business developments from general excitement, rumors or speculative commentary. Track sentiment changes and disagreement rather than treating a high positive score as an automatic buy signal.
Limitation: Social-media users are not a representative sample of all investors. Posts can be coordinated, automated or influenced by recent price moves. A strategy that works during one market regime may fail when sentiment patterns change.
Study 6 · Alternative data and market information
Do Earnings Have Information Content in the Era of Alternative Data?
Working paper: Initially posted in April 2025 and revised in March 2026 on SSRN.
Ma, Pan and Mergenthaler examine how the information content of earnings announcements changes when satellite-based parking-lot data becomes available for retail companies. Their working paper reports that the market response to unexpected earnings increases becomes larger for firms receiving satellite-data coverage relative to firms without that coverage around the rollout period.
Why this matters: Alternative data may complement traditional financial disclosures rather than make them obsolete. If investors can form independent estimates of retail activity, the official earnings announcement may help them judge whether their estimates were right, wrong or incomplete.
Practical application: Build systems that compare alternative-data estimates with reported revenue, earnings and analyst expectations. When the numbers disagree, investigate the reason instead of automatically trusting the model or the reported result.
Limitation: This is a working paper, so its findings should be treated as research evidence rather than settled consensus. Its focus is specific to satellite-data coverage and retail earnings, not all companies or all alternative datasets.
What the Research Collectively Tells Investors
Across these studies, three themes stand out. First, alternative data can add information about business activity, attention and market behavior. Second, the meaning of a signal depends on the source and the forecast horizon. Third, measurement quality is critical: a poorly defined proxy can create misleading results even when the model itself is technically sophisticated.
| Research lesson | What it means in practice | What not to assume |
|---|---|---|
| Alternative data adds another view | Use it to test and improve operating estimates. | That traditional financial analysis is no longer needed. |
| Forecast horizons matter | Connect high-frequency data to outcomes it can plausibly predict. | That a short-term signal predicts long-term value. |
| Measurement errors can dominate | Validate definitions, coverage, timestamps and company mapping. | That a large dataset is necessarily a good dataset. |
| Sentiment is not fundamentals | Separate business evidence from attention and emotion. | That positive discussion means a stock is undervalued. |
| Signals need economic interpretation | Connect data to revenue, margins, cash flow, valuation and risk. | That statistical correlation alone establishes a trading edge. |
Industry Developments: Why AI and Alternative Data Are Converging
The commercial market for alternative data is expanding alongside the ability to process unstructured information. In February 2026, Business Insider reported that hedge funds and asset managers spent an estimated $2.8 billion on alternative data in 2025, citing research from Neudata. The article described spending as 17 percent higher than the previous year and more than double the 2021 level. These figures are estimates reported by a third-party publication, not a guarantee of future market growth or investment performance.
The development matters because datasets once difficult to process at scale are becoming more accessible to teams with modern data infrastructure and AI tools. Models can help classify millions of records, summarize changes, identify anomalies and connect information from multiple sources. However, easier analysis also means that a signal may become less distinctive when more investors discover it.
Reuters reported in November 2024 that investors were using sources such as card transactions, consumer sentiment, mobile-location information and social activity to estimate retailer performance. The report described how these sources could help investors investigate consumer trends before traditional reporting periods end. The practical lesson is not that any one dataset will forecast earnings accurately in every case, but that investors are increasingly testing direct evidence of business activity against published company numbers.
Market infrastructure is evolving too. On October 14, 2026, Reuters reported a partnership between the London Stock Exchange Group and NVIDIA aimed at accelerating the processing of historical market data. The report described a very large historical data environment and plans connected with a future London Stock Exchange 24-hour trading platform. This is not evidence that alternative data alone improves stock selection, but it illustrates the broader direction: financial firms are investing in systems that can process larger and more complex information streams.
At the same time, more data does not eliminate uncertainty. Investors must still decide whether a dataset measures the right thing, whether it is legally usable, whether the signal survives realistic trading costs and whether the market has already priced in the information.
Industry sources: Business Insider on alternative-data spending, Reuters on investors tracking retail performance and Reuters on LSEG and NVIDIA market-data processing.
A Practical Example: Using AI to Evaluate a Retail Stock
Imagine an investment research team evaluating a US-listed retailer before its next earnings announcement. The team wants to know whether the company’s sales could exceed or fall short of current expectations. Instead of using one dataset as the answer, it builds a structured evidence process.
Illustrative research dashboard
The following values are hypothetical examples to explain a workflow. They are not current data for any real company and are not a stock recommendation.
Online traffic
+12%
Year-over-year
Spending sample
+7%
Year-over-year
Customer reviews
Mixed
Product complaints rising
Model confidence
Medium
Signals disagree
Interpretation
Web traffic and spending appear to be improving, but customer complaints introduce uncertainty. The next step is to check product availability, promotional discounts, margins, comparable retailers and current earnings expectations before reaching a conclusion.
The team then checks whether the spending sample covers enough customers and locations to represent the business. It compares current activity with the same seasonal period in previous years, removes unusual promotional effects where possible and records when each observation became available. It also checks whether the dataset has changed its coverage or collection method.
Next, the model estimates a range of possible revenue outcomes rather than claiming to know the exact number. Analysts compare those estimates with public consensus forecasts, recent company guidance, margins and valuation. If the model indicates stronger demand but the stock price already reflects unusually optimistic growth assumptions, the stock may still be unattractive.
The final output should explain the evidence, uncertainty and possible reasons the thesis could be wrong. This is more useful than a black-box score that labels the stock a buy without showing the assumptions behind the result.
From a Predictive Signal to a Stock-Picking Decision
A practical stock-picking framework should separate the prediction of business activity from the decision to invest. A useful process has several layers: estimate the business outcome, compare it with expectations, assess valuation, consider risk and determine whether the signal is strong enough to justify further research.
| Decision layer | Questions to ask | Useful evidence |
|---|---|---|
| Business momentum | Is demand or operating activity changing? | Spending, traffic, reviews, logistics and hiring |
| Financial impact | Could the change affect sales, costs or margins? | Financial statements, pricing, costs and analyst estimates |
| Expectation gap | Does the evidence differ from what the market expects? | Consensus estimates, company guidance and recent price moves |
| Valuation | Is the expected improvement already reflected in the price? | Cash-flow forecasts, multiples and scenario analysis |
| Portfolio risk | What could invalidate the thesis or increase losses? | Liquidity, concentration, volatility and downside scenarios |
This framework also helps avoid a common mistake: confusing prediction accuracy with investment performance. A model may correctly forecast sales growth but still lose money if the market expected even stronger growth. Another model may have a modest forecasting advantage but generate more useful stock rankings because it identifies unexpected changes that are not fully reflected in prices.
How to Test Whether an Alternative Data Signal Actually Works
A backtest can look impressive even when the underlying strategy is not reliable. The most common causes include future information leaking into the model, selecting the best result from thousands of experiments, ignoring failed companies, underestimating trading costs and testing on data that does not resemble the conditions in which the strategy will operate.
Use point-in-time data
Every observation should have a clear timestamp showing when it became available to the investor, not just the period it describes. If a dataset is later revised, the backtest should not use the revised value as though it had been available months earlier. This is especially important for vendor datasets that backfill historical records or adjust company mappings.
Use time-ordered validation
Randomly splitting financial time-series data can allow information from the future to influence the model’s training process. A stronger approach trains on an earlier period, validates on a later period and tests on a still later period. Walk-forward testing repeats this process as time advances. Where labels overlap or observations have long look-ahead windows, additional safeguards may be necessary to reduce leakage.
Measure portfolio outcomes, not only prediction accuracy
Accuracy, correlation and error metrics help describe a model, but they do not tell the whole investment story. The evaluation should also consider portfolio returns, drawdowns, turnover, liquidity, transaction costs and exposure to common market factors. A strategy that looks profitable before costs may become unattractive after spreads, market impact, financing and data expenses.
Backtesting checklist
- Was each record available before the simulated trading decision?
- Were delisted companies and historical index constituents included where relevant?
- Were data cleaning, feature selection and model tuning kept separate from the final test period?
- Were transaction costs, spreads, market impact and realistic execution delays included?
- Was performance compared with a relevant benchmark and simple baseline models?
- Was the strategy tested across different market conditions and company groups?
- Were the number of experiments and the risk of overfitting documented?
- Can the result be reproduced from stored data versions, model versions and code?
Risks, Biases and Limitations
Alternative data can reveal useful information, but it can also create false confidence. A dataset may look predictive because it captures an event that occurred at the same time as a stock-price change, not because it caused or reliably anticipated that change. The relationship may disappear when the market environment changes or when other investors adopt the same approach.
Data quality and representativeness
Transaction data may cover only a subset of banks or customers. Web analytics can be distorted by bots, changes in privacy settings or a company’s marketing campaigns. Social data may overrepresent highly active users. Satellite imagery may miss activity because of clouds, image timing or site-specific conditions. Before modelling, teams should understand who or what the dataset covers and what it leaves out.
Data mining and overfitting
When researchers test many indicators, time periods and model settings, some combinations will appear successful by chance. The risk increases when the same historical period is repeatedly used to choose the final model. Keep a research log, document failed experiments and reserve untouched data for final evaluation. Independent replication can help determine whether an apparent discovery is robust.
Signal decay and competition
A dataset may provide an advantage when few investors use it, then become less useful as adoption spreads. Data providers can also change their methods, prices or coverage. Teams should monitor whether a signal’s predictive power, stability or cost-effectiveness deteriorates. A model should be allowed to stop producing a signal when its supporting evidence is no longer reliable.
Privacy, licensing and regulatory exposure
Financial firms need to establish that data was collected and supplied lawfully, that contracts permit the intended use, and that sensitive or personal information is handled appropriately. Public accessibility does not automatically mean unlimited rights to collect, republish or use information for investment purposes. Data sourced from individuals, location services or digital platforms may raise privacy and contractual questions.
US investment managers and financial businesses should obtain legal and compliance advice on applicable securities laws, privacy rules, vendor contracts, recordkeeping and potential material nonpublic information issues. This report is educational and does not provide legal advice. A data vendor’s assurance alone may not resolve every legal or compliance concern for the buyer.
Recommendations for Developers Building Alternative Data AI Systems
Developers should treat an alternative-data platform as a research system with traceable evidence, not simply a machine learning model connected to a data feed. A dependable architecture should make it possible to explain where each signal came from, when it became available, how it was transformed and how it contributed to a decision.
- Build data provenance into the system. Store source identifiers, retrieval timestamps, publication timestamps, licensing details, transformation versions and quality flags. This makes point-in-time testing and later audits more practical.
- Separate ingestion from feature generation. Use repeatable pipelines to validate schemas, detect missing values, remove duplicates and identify changes in source coverage before the data reaches a model.
- Start with a baseline. Compare the AI model with simple historical averages, linear models and fundamental-only forecasts. If the more complex system does not improve out-of-sample results, do not assume complexity adds value.
- Use models suited to each data type. Language models may help interpret text, computer vision can process images, and tree-based models can work well with structured tabular features. Combine their outputs only when there is evidence that the combination helps.
- Make explanations part of the output. Provide the main contributing features, supporting records, uncertainty estimates and known limitations. Avoid presenting model explanations as proof of causation.
- Monitor data and model drift. Alert the team when source coverage changes, features become unavailable, predictions become poorly calibrated or live performance diverges from the test results.
- Control costs and access. Evaluate data subscription fees, storage, compute, latency and vendor lock-in. Restrict access to licensed datasets and maintain appropriate security controls.
Developers working on trading applications may also benefit from understanding the execution layer. An attractive signal can still produce weak results if orders are poorly timed or liquidity is limited. See AICOPSE’s related guide on AI in Algorithmic Trading and Automated Strategy Execution and its discussion of AI in Algorithmic Trading and High-Frequency Trading Execution.
Recommendations for Startups and Investment Businesses
Startups do not need to build a hedge-fund-scale data platform on day one. The strongest initial approach is often to select one industry, one investment question and a small number of legally accessible datasets. A narrow product can be evaluated more clearly than a broad dashboard containing hundreds of indicators without a demonstrated use case.
For financial technology startups
- Choose a defined customer. A tool for fundamental analysts may need transparent company-level evidence and earnings estimates. A quantitative trading team may need machine-readable features, point-in-time history and low-latency delivery.
- Validate willingness to pay. Interview research teams and portfolio managers to identify which decisions take time, which datasets they already use and what evidence would justify paying for another signal.
- Prove incremental value. Show whether the product improves an existing workflow or forecast, rather than merely displaying information that customers can already access elsewhere.
- Build defensibility carefully. Proprietary labels, reliable entity mapping, historical data quality and domain-specific validation may be more defensible than using a widely available model alone.
- Set clear product boundaries. Distinguish research analytics from personalized investment advice or automated execution. The correct legal and compliance obligations depend on the service and how it is delivered.
For asset managers and research teams
- Use a staged procurement process. Start with a trial and a clear hypothesis, then test coverage, reliability and incremental performance before committing to a long-term contract.
- Compare vendor data with independent evidence. Investigate whether the vendor’s signal tracks actual operating outcomes and whether it remains useful outside the period shown in marketing materials.
- Measure the total cost of ownership. Include subscription fees, engineering work, storage, compute, compliance reviews and ongoing maintenance.
- Keep human review where it matters. Analysts should investigate surprising signals, conflicting data and decisions that could create significant portfolio risk.
- Document the investment rationale. Store the evidence, assumptions, model version and decision timestamp so the team can evaluate both successful and unsuccessful decisions.
A 90-Day Implementation Roadmap
A staged rollout can help teams determine whether alternative data adds value before they invest heavily in infrastructure. The schedule below is an example, not a guarantee that a working strategy can be developed within three months.
Days 1–15
Choose the use case and target universe
Define the outcome to predict, the investment horizon, the companies to cover, the available budget and the baseline method. Write down what result would count as a meaningful improvement.
Days 16–35
Audit and prepare the data
Assess provider rights, coverage, history, update frequency and point-in-time availability. Build repeatable ingestion, validation and entity-mapping steps.
Days 36–60
Build and evaluate the first model
Create a small feature set, compare simple and advanced models, use time-ordered validation and test whether the data adds information beyond a baseline.
Days 61–90
Run a paper portfolio and review results
Record signals without committing capital, compare expected and realized outcomes, assess trading assumptions and investigate failures. Proceed only if evidence supports the next stage.
Future Predictions: Where AI Alternative Data Mining Is Heading
The following predictions are evidence-informed expectations, not confirmed outcomes. They draw on the research reviewed above and the direction of financial data infrastructure and AI development.
More multimodal research systems
Investment teams are likely to combine structured transactions, text, images, geospatial information and traditional financial data more routinely. Rather than treating each source as a separate dashboard, future systems may connect observations to the same company, product, supplier or location. This can help analysts compare evidence across different parts of a business. It will also increase the need for careful timestamping, entity resolution and conflict handling.
More focus on company-level estimates, not generic sentiment scores
Simple measures such as positive or negative online sentiment can be easy to copy and difficult to interpret. A more useful system may estimate specific operating indicators, such as product demand, store activity, hiring pressure or delivery delays, and explain how these indicators could affect financial results. The most valuable tools will need to connect the data to an economic question rather than just summarize large volumes of text.
Data provenance and compliance will become product features
As more investment workflows use AI, customers will increasingly need to know where an observation came from, when it became available and what rights govern its use. Systems that preserve lineage, document model changes and support audits may be more useful to regulated financial firms than tools that produce a score without traceable evidence.
The advantage may shift from access to interpretation
As more vendors sell alternative datasets and AI tools become easier to use, access alone may provide a smaller advantage. The differentiator may be better company mapping, cleaner history, stronger feature engineering, sensible economic interpretation and disciplined testing. A dataset that many investors can buy may still be valuable if a team understands it better, but that advantage must be demonstrated rather than assumed.
Signals will need continuous revalidation
Markets adapt. Competitors may adopt similar tools, customer behavior may change, and the relationship between a dataset and company performance may weaken. More teams will need monitoring systems that detect changes in coverage, calibration, turnover and performance. A strategy should not be considered permanently validated because it once passed a backtest.
Smaller teams may gain access, but not guaranteed returns
Cloud infrastructure, open-source libraries and AI-assisted data processing can lower some technical barriers. Startups and independent researchers may be able to test ideas that once required a large engineering team. However, affordable tools do not remove the cost of high-quality data, compliance, realistic execution or rigorous research. Broader access can also make simple signals more competitive.
Expert recommendation
Treat AI alternative data mining as a disciplined evidence system, not a shortcut to market prediction. Start with a clear business question, choose data that measures a plausible driver, preserve point-in-time history and compare the model with a simple baseline.
Before using a signal in a live portfolio, verify that it adds value after realistic costs and that the result survives different periods, companies and market conditions. If the system cannot explain its evidence, cannot reproduce its results or depends on information that was unavailable at the time, it is not ready to support a serious investment decision.
How This Topic Connects With Other AI Finance Applications
Alternative data mining is one part of a wider AI investment workflow. The data can inform financial forecasts, stock selection and portfolio research, while other AI systems help develop trading rules, monitor execution and manage risk. These applications should be evaluated separately because a better business forecast does not automatically produce better order execution or portfolio returns.
- AI in Predictive Financial Modeling and Market Forecasting explores how AI can support financial estimates and market analysis.
- AI in Stock Market Trading Strategy Development looks at the process of developing and testing investment strategies.
- AI in Algorithmic Trading and Automated Strategy Execution explains how research signals may feed into systematic trading workflows.
- AI in Algorithmic Trading and High-Frequency Trading Execution covers the distinct execution challenges involved in faster trading systems.
Frequently Asked Questions
What is alternative data mining in stock picking?
It is the process of collecting and analyzing nontraditional information, such as consumer spending, web activity, satellite imagery, search trends and supply-chain records, to improve research into companies and potential stock investments. AI can help identify patterns in these sources, but the resulting signals need independent validation.
How does AI improve alternative data analysis?
AI can process large datasets, classify text, recognize patterns in images, detect anomalies and combine different signals. Its usefulness depends on data quality, the model’s design and whether the result improves forecasts or investment decisions outside the training sample.
Which alternative data sources are useful for stock picking?
Consumer transactions, web and app activity, search trends, social-media discussions, product reviews, satellite imagery, job postings and logistics records can all be useful in the right context. The most appropriate source depends on the company’s business model and the outcome being forecast.
Can alternative data predict stock prices accurately?
Some datasets can help forecast specific business outcomes or identify patterns in returns, as individual studies demonstrate. However, no source or model predicts stock prices reliably in every market condition. Price movements also depend on valuation, expectations, liquidity, interest rates, news and other factors.
Is alternative data better than traditional financial data?
Not in every situation. Alternative data may offer a more timely view of certain business activities, while financial statements provide structured information about reported revenue, expenses, assets, liabilities and cash flows. Combining the two can help investors test expectations and investigate differences between estimates and reported results.
Can a startup build an AI stock-picking product?
Yes, a startup can develop research tools that analyze alternative data, rank companies or estimate business trends. A sensible first step is to focus on one industry and one measurable question, use data with clear usage rights, test against simple baselines and demonstrate incremental value before expanding the product.
What is the biggest risk when using alternative data?
One of the biggest risks is mistaking a noisy or biased relationship for a dependable predictive signal. Look-ahead bias, overfitting, weak company mapping, changes in source coverage, licensing issues and trading costs can all undermine an apparently successful strategy.
How should investors validate an AI stock-picking model?
Use point-in-time data, time-ordered or walk-forward tests, untouched evaluation periods and realistic transaction costs. Compare the model with relevant baselines, test different market conditions, document unsuccessful experiments and monitor live or paper-trading performance for deterioration.
Research Sources and Further Reading
The sources below support the research discussion, explain the methods and findings described above, or provide context on the alternative-data industry. Research papers and working papers may differ in their review status, scope and strength of evidence. Read the original publication before relying on any specific result.
- Sun, Y. and colleagues. Alternative Data in Finance and Business: Emerging Applications and Theory Analysis. Financial Innovation, December 2024. Read the paper.
- Dessaint, O., Foucault, T. and Frésard, L. Does Alternative Data Improve Financial Forecasting? The Horizon Effect. The Journal of Finance, 2024. Read the paper.
- Ha, J. Institutional Trading and Satellite Data. Finance Research Letters, January 2025. Read the paper.
- deHaan, E., Lawrence, A. and Litjins, R. Measuring Investor Attention Using Google Search. Management Science, online publication in 2024. Read the research summary.
- Krystyniak, K., Liu, H. and Hu, H. What’s Trending? Stock-Level Investor Sentiment and Returns. International Journal of Financial Studies, August 2025. Read the paper.
- Ma, M., Pan, J. and Mergenthaler, R. Do Earnings Have Information Content in the Era of Alternative Data? SSRN working paper, originally posted April 2025 and revised March 2026. Read the working paper.
- Reuters. Investors Mining New Data to Predict Retailers’ Results. November 25, 2024. Read the report.
- Reuters. LSEG Teams Up With NVIDIA for Faster Historical Market-Data Processing. October 14, 2026. Read the report.
- Business Insider. Money Managers Are Hungrier Than Ever for Obscure Data to Give Them an Edge. February 2026, reporting estimates attributed to Neudata. Read the report.
Disclaimer
This report is for educational and informational purposes only. It is not investment, legal, tax or financial advice, and it does not recommend buying or selling any security. Research findings may depend on the dataset, period, methodology and market conditions studied. Past research performance does not guarantee future results. Investors and businesses should conduct their own due diligence and consult qualified professionals where appropriate.

Leave a Reply