
AI RESEARCH REPORT | QUANTITATIVE FINANCE
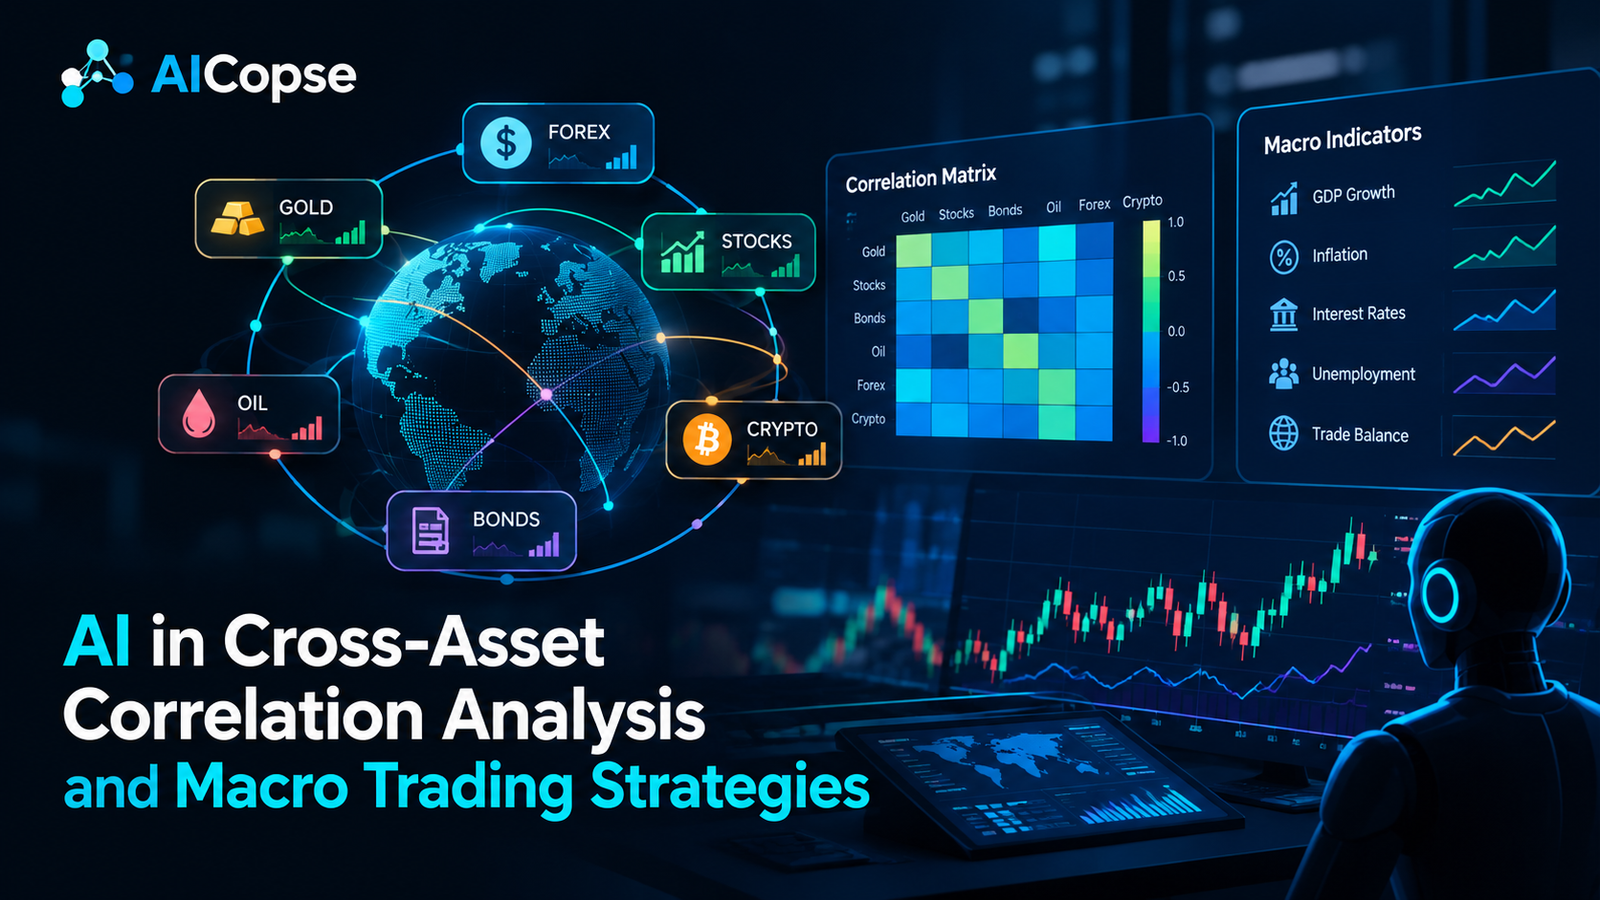
AI in Cross-Asset Correlation Analysis and Macro Trading Strategies
How artificial intelligence can help traders connect interest rates, currencies, equities, bonds, commodities and macroeconomic signals to build more informed systematic trading strategies.
AI and machine learning
Global markets
Executive summary
Financial markets do not move in isolation. Changes in US Treasury yields can affect technology stocks, the US dollar, gold and emerging markets. Oil prices can influence inflation expectations, bond yields, currencies and the outlook for energy companies. Central bank decisions can change several of these relationships at once.
AI can help traders study these connections by combining market prices, economic data, news, volatility measures and cross-asset relationships. Instead of assuming that two assets will always move together, a well-designed system can estimate how their relationship changes across growth, inflation, liquidity and risk regimes.
The main conclusion of this report is that AI is most useful when it improves a complete decision process, not merely when it predicts the next price movement. A practical system needs reliable data, meaningful economic features, time-aware validation, portfolio risk limits and realistic transaction-cost estimates.
What is cross-asset correlation analysis?
Cross-asset correlation analysis measures how returns or other market variables move in relation to one another. The assets may belong to different markets, such as equities, government bonds, currencies, commodities, credit and digital assets. Traders use these relationships to understand diversification, detect possible spillovers and identify trading opportunities.
For example, when US Treasury yields rise, long-duration bonds may fall in price. Higher yields may also put pressure on some growth stocks because future earnings become less valuable when discounted at higher rates. The US dollar may strengthen if the change in yields reflects a more attractive interest-rate outlook. Gold, however, can respond differently depending on real yields, currency movements, geopolitical risk and demand for safe assets.
These relationships are conditional, not permanent. Rising yields caused by stronger economic growth can produce a different equity response from rising yields caused by inflation fears or concerns about government debt. AI can help estimate those changing conditions, but it cannot eliminate uncertainty about why markets move.
A cross-asset market map
Macroeconomy
Growth, inflation, jobs
Central banks
Rates, policy guidance
Market conditions
Liquidity, risk appetite
Equities
Stocks and sectors
Fixed income
Yields and credit
FX
Currency pairs
Commodities
Energy and metals
Conceptual framework: economic conditions influence markets through several channels. The relationships may be delayed, nonlinear or different across regimes.
Why correlation alone is not enough
Correlation describes the strength and direction of a statistical relationship. It does not prove that one asset causes another to move, that the relationship will continue or that a profitable strategy exists.
Suppose a model finds that gold and a currency index often move in opposite directions. That relationship may weaken if real interest rates change, central banks alter their policies or investors suddenly seek safety. A strategy that relies on the historical average can then produce losses precisely when the market is most unstable.
There are four important distinctions:
- Correlation: measures how two variables move together over a selected period.
- Lead-lag relationship: examines whether movements in one market contain information about a later movement in another.
- Cointegration: tests whether a long-run combination of certain non-stationary price series behaves in a statistically stable way.
- Causal mechanism: explains why a relationship might exist, such as the effect of real yields on gold or interest-rate differences on currency valuations.
A strong quantitative system combines these views rather than treating one correlation coefficient as a trading signal. It also distinguishes correlation between returns from correlation between price levels. Price levels can trend together for reasons that do not translate into a reliable return-prediction strategy.
How AI improves cross-asset analysis
Traditional analysis often uses fixed relationships, linear regressions or historical correlation matrices. These tools remain useful because they are easy to inspect and provide strong benchmarks. AI adds the ability to examine more variables, learn nonlinear relationships, detect changing market states and combine structured data with text-based information.
Core applications
Dynamic correlation estimates
Estimate how relationships change with volatility, liquidity, monetary policy and market stress rather than relying on one fixed historical window.
Macro regime detection
Classify conditions such as accelerating growth, falling inflation, stagflation risk or financial stress and measure how asset relationships differ between them.
Cross-market forecasting
Test whether rates, currencies, commodity movements or credit spreads contain useful information about subsequent returns elsewhere.
Portfolio and hedge design
Use forecasts of risk, covariance and regime probabilities to adjust exposure, reduce unwanted concentration and evaluate alternative hedges.
For example, a model may identify a period when the US dollar, Treasury yields and technology stocks are unusually sensitive to the same inflation surprise. A portfolio that holds all three may look diversified by asset label while carrying a common macroeconomic risk. AI-based risk analysis can help expose that hidden concentration.
The model should not automatically short any asset whose correlation changes. It should estimate whether the relationship is statistically reliable, economically plausible and tradable after costs.
The main asset relationships macro traders monitor
| Market relationship | Potential macro driver | What an AI model can test | Key risk |
|---|---|---|---|
| Treasury yields and growth stocks | Real rates, growth outlook, discount rates | Whether rate changes predict sector returns in different regimes | Strong growth can support earnings even as yields rise |
| US dollar and emerging markets | Dollar funding, capital flows, global liquidity | Which currencies and markets are most sensitive to dollar moves | Local policy and country-specific shocks |
| Oil and inflation-linked assets | Supply shocks, demand, inflation expectations | Whether oil shocks change inflation expectations and bond pricing | Supply disruptions differ from demand-driven price rises |
| Gold and real yields | Opportunity cost, dollar strength, safe-haven demand | When real rates or risk sentiment have greater explanatory power | Geopolitical demand can override normal relationships |
| Credit spreads and equities | Default risk, financing conditions, recession expectations | Whether credit deterioration precedes equity weakness | Spread changes can reflect liquidity rather than defaults alone |
| Rates and FX forwards | Policy-rate differences, hedging costs, capital flows | Whether rate differentials add predictive information after carry and costs | Currency risk, forward pricing and sudden policy changes |
These are research hypotheses, not universal rules. A robust system tests the relationship using point-in-time data, different market regimes and a realistic trading process before allocating capital.
Six research studies that matter for AI macro trading
The studies below offer evidence about factor correlation, cross-market transmission, macro forecasting and AI-assisted portfolio decisions. Their findings are not interchangeable. Some are peer-reviewed empirical papers, while the newest work on language models has a shorter evaluation period and should be interpreted with extra caution.
STUDY 1 | 2024
Factor correlation and the cross section of asset returns: A correlation-robust machine learning approach
Published in: Journal of Empirical Finance, Volume 77, 2024.
Research question: What happens when many financial factors are highly correlated, and can machine learning select useful factors without allowing those correlations to distort the results?
Chuanping Sun studies high-dimensional factor models and develops a correlation-aware machine learning approach using a stochastic discount factor framework. The research reports that factor correlations can undermine methods such as LASSO, Elastic Net and Fama-MacBeth regression when they are applied without adequate attention to the relationships between factors. The paper identifies the market factor as especially important and also highlights profitability, momentum and liquidity-related information.
Why this matters for cross-asset strategies: Macro traders often use variables that overlap. Inflation expectations, nominal yields, real yields, the dollar and central bank policy can all contain related information. Feeding every variable into a model does not automatically improve a forecast. The model may assign unstable importance to one feature simply because another highly correlated feature is present.
Practical lesson: Group related variables, test feature stability and compare the AI model against simpler regularized baselines. Review whether a model’s trading decisions change dramatically when one correlated feature is removed.
Limitation: This is research into factor selection and cross-sectional asset returns, not proof that a particular cross-asset macro strategy will generate live profits.
STUDY 2 | 2024
Cross-Asset Tandem Trading and Extraordinary Volatility
Published in: Journal of Futures Markets, 2024.
Research question: Can order flow in one market provide information about price movements and volatility in another market?
Research by Pankaj K. Jain and Mark Paddrik examines synchronized intraday message data and uses structural vector autoregressions to investigate cross-asset order-flow relationships. The study reports that cross-asset order flow provides an additional nonlinear channel for price discovery. In simple terms, buying and selling pressure in one market can help explain developments in another, beyond what a single-market price history reveals.
Why this matters: A macro strategy may track Treasury futures, equity index futures, currency futures and commodity futures at the same time. These markets can respond to a shared economic release, but their reactions may arrive at different speeds. Order-flow information may help identify whether a move is being supported by broader market activity or is concentrated in one instrument.
Practical lesson: Separate slow macro signals from fast execution signals. A monthly inflation trend may influence the strategic view, while intraday liquidity and order flow can help determine when and how to implement the trade.
Limitation: Intraday message data require careful synchronization, high-quality feeds and realistic execution assumptions. Evidence about price discovery is not automatically evidence of a profitable trading strategy after fees and market impact.
STUDY 3 | 2024
Forecasting returns with machine learning and optimizing global portfolios: Evidence from the Korean and US stock markets
Published in: Financial Innovation, December 2024.
Research question: Can machine learning improve return forecasts and international portfolio construction when exchange-rate movements are also considered?
Dohyun Chun, Jongho Kang and Jihun Kim evaluate machine learning approaches using financial and economic variables to forecast the Korean won–US dollar exchange rate and returns in the US and Korean stock markets. The study reports improved out-of-sample forecasting results from LASSO and Elastic Net relative to traditional benchmarks. The authors also report strong historical Sharpe ratios for their machine learning-based global portfolios.
Why this matters: International macro trading cannot treat currency risk as a minor detail. A US investor holding foreign equities can lose money in dollar terms even when the local equity market rises. Likewise, a currency hedge can change the final risk and return profile of a global portfolio.
Practical lesson: Forecast asset returns and currency effects together where appropriate. Compare local-currency performance, unhedged dollar performance and hedged performance. Use consistent benchmark definitions and include the costs of currency hedging.
Limitation: Historical portfolio results depend on the sample, features, rebalance schedule and trading-cost assumptions. A reported Sharpe ratio should not be treated as a forward return forecast.
STUDY 4 | 2025
The pass-through of macro variable to volatility co-movement among US currency and commodity futures markets system
Published in: Journal of Commodity Markets, June 2025.
Research question: How do macroeconomic variables influence volatility co-movement across currency and commodity futures markets?
This study examines 22 futures markets using five-minute data and investigates the relationship between volatility measures and macroeconomic variables. It applies a dynamic equicorrelation framework with mixed-data sampling techniques, alongside analysis of multiple macroeconomic indicators. The approach is useful because macroeconomic data are often released monthly or quarterly, while market volatility changes much more frequently.
Why this matters: Cross-asset relationships can change after inflation reports, employment releases, central bank decisions and other major announcements. A daily or intraday risk model that ignores the timing of these releases may confuse ordinary market movement with a genuine change in the underlying relationship.
Practical lesson: Use release calendars, timestamped data and event windows. Test whether a model behaves differently before and after macroeconomic announcements. Distinguish good and bad volatility where the data and methodology support it.
Limitation: The study focuses on volatility co-movement, not a universal buy-or-sell rule. Its methods require careful implementation before they can guide a live portfolio.
STUDY 5 | 2025
Decoding systemic risks across commodities and emerging market stock markets
Published in: Financial Innovation, January 2025.
Research question: How are commodity markets and emerging equity markets connected through risk transmission?
Fahmi Ghallabi, Ahmed Ghorbel and Sitara Karim study relationships among crude oil, gold, a global commodity index and emerging stock markets. The research examines correlation and risk spillovers, which are important because a shock in one market can affect the risk profile of another market even when their long-run average returns are not closely related.
Why this matters: A portfolio may contain emerging-market equities, oil exposure and gold exposure with the aim of diversification. But the benefits can change during an energy shock, a global liquidity squeeze or a sudden shift in risk appetite. Correlation alone may not fully capture how a shock spreads across markets.
Practical lesson: Measure both normal-market dependence and stress-period dependence. Test whether commodity exposure reduces portfolio risk during different types of shock rather than assuming gold or any other asset is always a hedge.
Limitation: Risk transmission depends on the countries, assets, sample period and statistical framework. Results should not be generalized to every emerging market or every crisis.
STUDY 6 | 2026
Macro Economists in the Machine: A Multi-Agent LLM Framework for Commodity-Related ETF Portfolio Construction
Published online: October 8, 2026, in Cogent Economics & Finance.
Research question: Can large language models improve portfolio decisions when their role is limited to interpreting the same structured macroeconomic inputs available to a rules-based benchmark?
Kerui Geng, Yiqing Wang, Dehao Dai and Ding Ma compare hawkish, dovish and debate-style LLM agents with a deterministic rule-based agent and an inverse-volatility benchmark. The agents receive the same structured macro inputs, including measures related to volatility, the US dollar, policy rates, industrial production, inflation expectations, real yields and unemployment. The same portfolio engine and risk controls are used after the signal-generation stage.
The authors report that the LLM approaches outperform the deterministic rule-based agent in return-to-volatility terms across 124 weekly rebalancing dates. The reported advantage is concentrated in the 2024–2025 soft-landing period, and the debate agent does not clearly outperform the strongest single-agent approach. The authors also acknowledge the short sample, the limited number of rate-cycle conditions and uncertainty about whether the advantage persists.
Why this matters: This design addresses an important question: can an LLM improve the interpretation of macroeconomic conditions without receiving extra information or controlling the entire trading system? It also illustrates why model comparisons should hold portfolio construction and risk controls constant.
Practical lesson: Treat an LLM as a constrained research or signal-interpretation component. Require structured output, fixed exposure limits, auditable reasoning and independent validation. Compare it with simple rules and conventional machine learning models on the same data.
Limitation: A single historical evaluation window does not prove durable investment skill. Reported results are sensitive to the sample, benchmark, costs and statistical testing choices. This study is promising evidence, not proof that multi-agent LLM portfolios will outperform in future markets.
What the six studies collectively suggest
- Correlated inputs can make model estimates unstable if feature selection is not handled carefully.
- Information can pass between markets through order flow, macroeconomic releases and changes in risk appetite.
- Currency risk and international portfolio construction need to be evaluated together.
- Cross-market volatility and systemic spillovers deserve separate analysis from average correlation.
- AI can support macro interpretation, but short samples and regime dependence limit confidence in performance claims.
What recent market developments mean for AI macro strategies
Research findings become more useful when considered alongside changes in financial conditions. Recent developments also show why historical correlations cannot be treated as permanent laws.
Global financial conditions are increasingly interconnected
The Bank for International Settlements discussed in its 2025 Annual Economic Report how global financial conditions can spread across borders. Its analysis describes a changing financial system in which institutional investors, sovereign bond markets and FX swaps play important roles. It also reports increased cross-country co-movement in some financial conditions, particularly in government bond yields and corporate spreads.
For macro traders, this means that country labels and asset-class labels may not fully describe portfolio risk. A portfolio holding US, European and Asian assets can still be exposed to common global funding conditions. AI models should therefore track both local variables and shared global risk factors.
Source: BIS, Annual Economic Report 2025
AI investment itself is becoming a macro variable
A Federal Reserve Bank of New York staff report published in April 2026 examines how AI adoption may affect monetary policy, productivity, inflation dynamics and financial stability. It highlights the possibility that expectations about future AI-driven productivity and the actual pace of adoption may diverge. Such a gap can influence valuations and create risks even before the long-term economic effects become clear.
This creates a useful example for cross-asset research. AI investment can affect technology stocks, semiconductor supply chains, electricity demand, energy markets, credit exposure and government bond yields. A macro model may need to distinguish between optimism about future productivity and the immediate cost of financing large infrastructure investments.
Source: Federal Reserve Bank of New York, Staff Report 1192
Commodity markets require more than a simple inflation signal
In March 2026, McKinsey described changes in commodity trading linked to global trade, AI adoption and changing market structures. Commodity strategies need to consider supply constraints, logistics, energy transitions and the growing role of systematic analysis. A model that assumes every oil-price rise is inflationary may miss the difference between a supply disruption and stronger global demand.
For implementation, AI should combine price data with relevant supply, inventory, demand and macroeconomic information where reliable data are available. The system should also distinguish futures returns from spot-price movements because contract rolls and the futures curve affect realized returns.
Cross-asset execution is becoming a strategic challenge
A September 2026 industry analysis from LSEG describes how relative-value trading has expanded beyond traditional equity pairs into equities, futures, fixed income, FX and commodities. It highlights the practical challenges of coordinating multiple legs, managing cross-currency exposure and reducing the risk of entering one position before the other.
This is important because a model may identify an attractive relationship but still fail to capture its expected return. Different market hours, liquidity conditions, margin requirements and execution speeds can make a theoretically attractive trade expensive or difficult to implement.
Source: LSEG, September 11, 2026
Competitor research and content gap analysis
A useful content strategy should explain what existing resources already cover and where readers still need more practical guidance. The following is a sampled content landscape review, not an exhaustive search-results ranking audit. It identifies established resources and the subjects they emphasize.
| Resource | Main focus | What this report adds |
|---|---|---|
| BIS | Global financial conditions and cross-border connections | Connects systemic macro analysis to AI signals, portfolio construction and strategy validation |
| Federal Reserve Bank of New York | AI, monetary policy and financial stability | Translates macro-financial concerns into practical cross-asset model design and monitoring |
| LSEG | Cross-asset relative-value trading and execution | Connects execution risk with AI correlation forecasts and portfolio risk limits |
| CFA Institute Research Foundation | Machine learning in commodity futures | Places commodity modeling within a broader macro and cross-asset strategy framework |
| Macrosynergy | Machine learning for international trading strategies | Highlights implementation questions around local versus global data, validation and portfolio design |
| Financial Innovation | Machine learning, exchange rates and global portfolios | Explains how to extend predictive research into operational checks and realistic risk controls |
The content gap this report addresses
Many resources explain one piece of the problem well: correlation estimation, macroeconomic research, commodity modeling, portfolio optimization or execution infrastructure. The opportunity for a more useful guide is to connect these pieces into one coherent system.
- From correlation to decision: explain how a measured relationship becomes a forecast, a position and a risk-controlled trade.
- From a forecast to a portfolio: discuss how several signals can create overlapping exposure to the same macroeconomic driver.
- From a backtest to implementation: account for transaction costs, futures rolls, FX hedging, market impact and different trading hours.
- From AI experimentation to governance: define monitoring, model-change controls, human review and conditions for stopping a strategy.
- From historical performance to uncertainty: explain why performance can deteriorate when the market regime changes or the underlying relationship disappears.
This integrated angle is relevant to AICOPSE readers because it links AI development with the real needs of financial businesses, quantitative researchers and developers. It also avoids presenting AI as a shortcut to guaranteed trading profits.
AI methods for cross-asset correlation analysis
There is no single best model for every market. The right choice depends on the prediction target, data frequency, available history, portfolio size and need for interpretability. In many projects, a combination of simpler statistical methods and machine learning is more practical than a single complex model.
| Method | Best use | Main weakness |
|---|---|---|
| Rolling correlation | Simple monitoring and baseline comparison | Sensitive to window choice and extreme observations |
| EWMA and dynamic covariance | Giving more weight to recent market behavior | May react too slowly or too quickly after a regime shift |
| DCC-GARCH | Modeling changing correlations and volatility | Estimation and specification risk |
| PCA and factor models | Finding shared drivers across large asset universes | Factors can be hard to interpret and may change over time |
| LASSO and Elastic Net | Selecting useful features and controlling model complexity | Can still be unstable when inputs are strongly related |
| Gradient boosting | Nonlinear relationships in structured macro data | Can overfit and require careful time-aware tuning |
| Neural networks and transformers | Complex temporal patterns across many variables | Data demands, limited interpretability and unstable generalization |
| LLMs and multi-agent systems | Summarizing economic releases and structuring macro scenarios | Hallucinations, inconsistent output and weak evidence of persistent alpha |
For most early-stage projects, a sensible sequence is to build a rolling-correlation baseline, add regularized regression or gradient boosting, and then test more complex models. This makes it easier to measure whether the additional complexity improves out-of-sample performance.
A practical AI macro trading architecture
A production-ready strategy should separate data collection, signal research, portfolio decisions and order execution. This design makes it easier to identify which component caused a loss or unexpected result.
1. Data ingestion
Prices, yields, FX, futures curves, macro releases and news timestamps
2. Data quality and alignment
Time zones, missing observations, point-in-time values and contract rolls
3. Correlation and regime engine
Dynamic covariance, factor exposures, stress indicators and regime probabilities
4. Forecast and uncertainty
Expected return, risk forecast, confidence and alternative scenarios
5. Portfolio construction
Exposure limits, hedging, turnover controls and risk budgeting
6. Execution and monitoring
Orders, transaction costs, slippage, fills, alerts and audit logs
Suggested system design. Each stage should be tested separately before the full strategy is deployed.
Data the system should collect
- Market prices: equity indices, sector ETFs, government bonds, futures, currencies, commodities and credit proxies.
- Interest-rate information: policy rates, government yields, real yields, yield-curve spreads and relevant forward-rate measures.
- Macroeconomic data: inflation, employment, industrial production, surveys and other variables relevant to the strategy.
- Event information: release dates, actual values, consensus estimates and revisions, with timestamps showing when the data became available.
- Trading costs: bid-ask spreads, commissions, market impact, funding, borrowing costs and futures roll costs.
- Risk information: realized volatility, drawdowns, liquidity measures, correlations, factor exposures and stress-period behavior.
US-focused strategies may use official sources such as the Federal Reserve Economic Data database, Bureau of Labor Statistics and Bureau of Economic Analysis. Global strategies need comparable sources for other countries and consistent definitions across jurisdictions.
Official data source: FRED, US Bureau of Labor Statistics and US Bureau of Economic Analysis.
From correlation to a trade: a worked example
Consider a hypothetical strategy that studies the relationship between US real yields and gold. The model estimates that the relationship has changed and forecasts a possible recovery in gold relative to the recent move in real yields. This forecast alone is not enough to place a trade.
The team must determine whether the signal is robust, whether other variables explain the movement, how much exposure to take and whether the expected return is large enough to cover implementation costs. The following calculation is illustrative, not a live market quote or investment recommendation.
| Illustrative component | Estimated amount |
|---|---|
| Expected gross gain if the signal works | $700 |
| Commissions and fees | −$80 |
| Spread and slippage | −$190 |
| Funding and other carrying costs | −$50 |
| Illustrative net gain | $380 |
In this example, estimated costs total $320. If execution costs were twice the expected amount, they would total $640 and the projected net gain would fall to $60. If the market relationship failed, the trade could still lose money. This illustrates why a strategy needs a margin of safety rather than a small positive forecast alone.
Useful formulas
Return correlation
ρ(A,B) = Cov(rA, rB) / [σ(rA) × σ(rB)]
Here, rA and rB are asset returns, Cov is covariance and σ is standard deviation. Correlation is bounded between −1 and +1.
Expected net trading edge
Expected net edge = expected gross trading gain − commissions − spread costs − slippage − financing costs − market impact
Every cost should be estimated for the actual instrument, trade size, holding period and execution method.
For a portfolio with several assets, the risk calculation must also account for their weights and covariance matrix. A simplified portfolio variance expression is:
Portfolio variance = wᵀΣw
Here, w represents portfolio weights and Σ represents the covariance matrix of asset returns. In practice, forecasts of volatility and covariance can be uncertain, so risk estimates should be stress-tested.
How to test whether the strategy is genuinely useful
A backtest can look excellent because the researcher accidentally used future information, selected a favorable period or tested so many variations that one appeared successful by chance. AI can increase this risk because complex models offer many parameters and feature choices.
A validation checklist
- Use point-in-time data: a model must not see an economic release before the actual publication time. Store revisions and release timestamps where possible.
- Use time-based splits: train on earlier data, tune on a later validation period and reserve a final untouched test period.
- Use walk-forward testing: repeat training and evaluation as the historical date advances, following the schedule intended for production.
- Prevent leakage: use purging or embargo methods where overlapping labels or forward return windows can contaminate validation.
- Control multiple testing: record the number of strategies, features, parameters and time windows tested. Use appropriate methods to assess backtest overfitting.
- Include realistic costs: model bid-ask spreads, commissions, market impact, funding, borrow fees, futures rolls and currency hedging costs where relevant.
- Test different regimes: include rising and falling rate periods, inflation shocks, calm markets, liquidity stress and sharp changes in risk appetite.
- Measure capacity: a strategy that works with small positions may fail when scaled because market impact increases.
- Compare simple baselines: evaluate rolling correlation, regularized regression, trend or carry benchmarks and passive alternatives.
- Track uncertainty: evaluate prediction intervals, signal stability, calibration and the impact of small changes in input data.
Useful performance measures include net returns, volatility, Sharpe ratio, maximum drawdown, turnover, downside risk, hit rate, average gain and loss, capacity and performance by regime. No single metric is enough. A high Sharpe ratio can be misleading if it comes from a short sample or omits rare but severe losses.
Research on backtest overfitting, including the work of Bailey and colleagues, provides useful background for quantitative strategy validation.
See research on the probability of backtest overfitting.
How developers can build a prototype
Developers should begin with a small, testable system rather than a complex autonomous trading agent. A first prototype can use daily data for a limited set of liquid instruments, a small group of macroeconomic variables and a clearly defined prediction target.
Suggested development stages
- Define the hypothesis. State which relationship is being tested, why it might exist, which market should react and over what horizon.
- Choose the universe. Select liquid instruments with reliable history and clear trading conventions. Document contract changes and corporate actions where relevant.
- Build a baseline. Calculate rolling correlations and compare them with a simple regression or a regularized model.
- Add macro features. Include only variables that were available at the time of each decision. Standardize features using historical information only.
- Test a regime model. Compare simple rule-based regimes with methods such as hidden Markov models or gradient boosting.
- Build portfolio constraints. Set gross exposure, net exposure, sector or factor limits, turnover limits and maximum loss thresholds.
- Model execution. Simulate costs using spreads, slippage, funding and realistic order timing.
- Run a paper-trading phase. Compare forecast behavior, expected costs and simulated fills with real market conditions before risking capital.
- Monitor production. Log inputs, model versions, decisions, rejected trades, fills, costs and risk alerts.
Python is a common choice for this work because it supports data analysis, statistical modeling and backtesting. Teams may use pandas and NumPy for data handling, statsmodels for econometric methods, scikit-learn for machine learning, and a backtesting or broker integration layer appropriate to the instruments they trade.
The engineering team should keep research code separate from production order-routing code. A model prediction must not be allowed to bypass exposure limits or trading permissions.
Recommendations for startups and financial businesses
Not every company needs to build a large AI trading platform. The right starting point depends on its data access, available capital, regulatory position, technical team and intended customer.
| Business type | Practical starting point | Main priority |
|---|---|---|
| Fintech startup | Build a cross-asset risk dashboard or macro scenario tool | Reliable data, explainable outputs and customer trust |
| Quant research startup | Test one relationship using walk-forward validation | Independent testing and transaction-cost realism |
| Asset manager | Use AI to support risk forecasting and scenario analysis | Portfolio constraints, model governance and auditability |
| Trading firm | Improve execution timing and cross-market risk estimates | Latency, market impact, legging risk and capacity |
| Enterprise software provider | Offer a data and analytics layer for macro teams | Security, uptime, data rights and integration |
| Independent developer | Build a reproducible research notebook and paper-trading demo | Clean data, documented assumptions and controlled scope |
A sensible startup roadmap
First stage: research product. Build a dashboard that displays rolling correlations, regime estimates and changes in cross-asset risk. Let users inspect the underlying data rather than showing only a single AI-generated score.
Second stage: decision support. Add scenario analysis, forecasts and alerts. Explain which variables changed, how confident the model is and which historical conditions are most comparable. Do not automatically convert every alert into an order.
Third stage: controlled execution. Only after extensive validation should the business consider order generation or broker integration. Start with strict exposure limits, human approval and a documented process for disabling the system.
Fourth stage: commercial readiness. Establish data licensing, cybersecurity, incident response, model documentation, customer disclosures and applicable legal or regulatory review. A backtested model is not, by itself, a commercial financial product.
Risks, limitations and governance
AI macro trading can fail even when the model is technically correct about a historical pattern. The market may change, the relationship may weaken or the cost of implementing the trade may exceed the available edge.
- Regime shifts: relationships estimated during a low-inflation period may fail during a supply shock or a major policy change.
- Data leakage: revised economic data, incorrect timestamps and future information can make a backtest look better than a live strategy.
- Model concentration: different models can learn similar signals and unintentionally create the same crowded positions.
- Liquidity risk: stressed markets may make it expensive or impossible to exit positions at expected prices.
- Execution risk: in multi-leg trades, one position may fill while the other does not, creating unintended market exposure.
- LLM reliability: language models may generate unsupported explanations, inconsistent structured outputs or plausible but incorrect interpretations of events.
- Operational risk: feed outages, stale data, API failures or unexpected software changes can lead to incorrect decisions.
- Governance risk: unapproved model changes or missing audit records can make it difficult to understand why a trade occurred.
For US businesses, regulatory and compliance requirements depend on the instruments, business model, clients and activities involved. Firms should obtain appropriate legal and compliance advice before offering investment recommendations, managing assets or deploying automated trading services. Global operations may face additional rules in each jurisdiction.
Expert recommendations
Based on the research reviewed here, the most useful implementation principles are the following.
- Begin with economic logic. Choose relationships that have a plausible financial explanation. Use AI to test and refine the hypothesis, not to replace economic reasoning entirely.
- Prefer robust signals over complex models. A small improvement that survives different periods and realistic costs is more valuable than a dramatic backtest result that disappears under minor changes.
- Model uncertainty explicitly. Forecasts should include confidence measures or alternative scenarios. Reduce risk when the model is outside the conditions in which it was tested.
- Separate signal generation from execution. A good forecast and a good execution policy are different components and should be evaluated separately.
- Stress-test correlations. Test what happens when historically diversifying assets begin moving together or when a hedge stops behaving as expected.
- Keep a human review process. People should be able to examine assumptions, challenge unusual signals and pause a strategy when the market changes materially.
- Document every version. Store training data definitions, feature sets, model versions, validation results and reasons for production changes.
- Evaluate net performance. Include all material costs and compare the strategy with relevant passive and simple quantitative benchmarks.
For readers exploring related AI-finance topics, AICOPSE also covers AI in predictive financial modeling and market forecasting, AI in algorithmic trading and automated strategy execution, AI in stock market trading strategy development and AI in algorithmic trading and high-frequency trading execution.
Future predictions for 2027–2030
The following predictions are informed projections based on the research and industry developments reviewed above. They are not confirmed outcomes, and the pace of adoption will depend on data quality, costs, regulation and actual performance.
PREDICTION 1
Regime-aware models will become more important
Models will increasingly distinguish between different causes of market moves, such as growth-driven yield increases and inflation-driven yield increases. Systems that use regime probabilities may become more useful than models built around one permanent correlation matrix.
PREDICTION 2
LLMs will expand as research assistants before becoming independent traders
Language models are likely to see continued use in summarizing economic releases, comparing central bank statements, generating structured scenarios and helping researchers investigate unusual relationships. Fully autonomous capital allocation will face a higher bar because of reliability, explainability and risk-control requirements.
PREDICTION 3
Execution quality will separate more successful strategies from weak ones
As signal-generation tools become easier to access, data quality, multi-asset execution, market impact and portfolio capacity may become more important sources of differentiation. Better forecasts will not necessarily lead to better realized returns if costs rise faster than the predicted edge.
PREDICTION 4
Shared AI and infrastructure exposures will enter macro risk models
AI-related investment, energy demand, data-center financing and technology valuations may become more relevant to cross-asset scenario analysis. Researchers will need to distinguish productivity gains from financing risk, concentration risk and expectations that may already be reflected in prices.
PREDICTION 5
Model governance will become part of the product, not an afterthought
Financial firms will face continued pressure to document model behavior, test failure scenarios, retain audit trails and explain why positions change. This will favor architectures that combine automated analysis with explicit controls and reproducible research.
These projections share one central idea: the strongest systems are likely to combine AI’s ability to process complex information with disciplined statistical testing, sound market knowledge and clear limits on risk.
Frequently asked questions
What is AI in cross-asset correlation analysis?
It is the use of machine learning and related AI methods to study how assets from different markets move together. A system may combine equities, bonds, currencies, commodities and macroeconomic variables to estimate changing relationships, forecast risk and support portfolio decisions.
Can AI predict correlations between stocks, bonds, currencies and commodities?
AI can estimate future correlations or identify conditions associated with changes in correlation. These estimates are uncertain, depend on data quality and can fail when market conditions change. They should be tested against simple statistical baselines and stress scenarios.
Which AI model is best for macro trading?
There is no universally best model. Rolling correlations, dynamic covariance models, regularized regression, gradient boosting and neural networks solve different problems. LLMs may be useful for interpreting text and structuring scenarios, while numerical models are generally better suited to explicit forecasting and portfolio calculations.
How does cross-asset correlation help manage portfolio risk?
It can reveal when assets that appear diversified are exposed to the same underlying risk. Combining correlation estimates with volatility, factor exposure and stress tests can help a portfolio manager identify hidden concentration and evaluate whether a hedge is likely to work under different conditions.
Is correlation the same as causation?
No. Correlation describes how variables move together. Causation requires stronger evidence about the mechanism connecting them. Macro trading research should combine statistical tests with economic reasoning and should not assume that a high correlation guarantees a future price response.
What data are needed to build an AI macro trading system?
Common inputs include asset prices, interest rates, yield curves, currency rates, commodity futures, inflation and employment releases, volatility measures and trading costs. Depending on the strategy, order-book data, news timestamps and point-in-time economic forecasts may also be useful.
Can a small startup build a cross-asset AI trading product?
Yes, a startup can begin with a risk dashboard, correlation monitor, macro scenario tool or research prototype. A production trading service requires additional work in data licensing, security, realistic testing, portfolio controls, broker integration and applicable compliance obligations.
How can researchers avoid overfitting?
Use time-based validation, walk-forward testing, an untouched final test period, point-in-time data, realistic costs and benchmarks. Track how many model variations were tested, and examine whether results persist across market regimes rather than relying on a single favorable historical period.
Will AI replace human macro traders by 2030?
That outcome is uncertain. AI may automate more data processing, scenario generation, monitoring and parts of execution. Human judgment is still important for interpreting unusual events, setting risk appetite, challenging model assumptions and managing decisions that fall outside tested conditions.
Conclusion
AI in cross-asset correlation analysis can help financial teams study connections between interest rates, equities, bonds, currencies, commodities and macroeconomic conditions. Its greatest value may come from identifying when relationships change, revealing hidden portfolio concentrations and improving the process used to evaluate trading decisions.
However, better pattern recognition does not automatically create a profitable strategy. Correlations can break, macroeconomic data can be revised, execution costs can erase a small advantage and complex models can overfit historical conditions. The research reviewed here supports a disciplined approach: use economic reasoning, compare AI with simple benchmarks, validate out of sample, measure uncertainty and include real-world costs.
For developers and startups, the most practical route is to begin with a narrow hypothesis and a transparent research pipeline. For financial businesses, the priority is to connect model outputs with portfolio controls, execution quality and governance. For researchers, the central challenge is proving that a relationship adds reliable value after costs and across different market regimes.
The long-term advantage will not come simply from using a more complex AI model. It will come from building a system that can recognize when its assumptions are no longer reliable and reduce risk before a small forecasting error becomes a large portfolio loss.
Research sources and further reading
- Sun, 2024. Factor correlation and the cross section of asset returns
- Jain and Paddrik, 2024. Cross-Asset Tandem Trading and Extraordinary Volatility
- Chun, Kang and Kim, 2024. Forecasting returns with machine learning and optimizing global portfolios
- Dai and co-authors, 2025. Macro variables and volatility co-movement in currency and commodity futures
- Ghallabi, Ghorbel and Karim, 2025. Systemic risks across commodities and emerging markets
- Geng and co-authors, 2026. Macro Economists in the Machine
- Bank for International Settlements, 2025. Financial conditions in a changing global financial system
- Federal Reserve Bank of New York, 2026. Artificial Intelligence and Monetary Policy
- LSEG, 2026. Has pairs trading outgrown the equity desk?
- CFA Institute Research Foundation, 2025. Machine Learning in Commodity Futures Markets
Disclaimer: This report is for educational and research purposes only. It does not provide personalized investment, legal or financial advice. Historical research and hypothetical calculations do not guarantee future results. Trading financial instruments, including derivatives and leveraged products, involves substantial risk of loss. Readers should independently verify research findings, assess data and implementation assumptions, and consult qualified professionals where appropriate.

Leave a Reply