
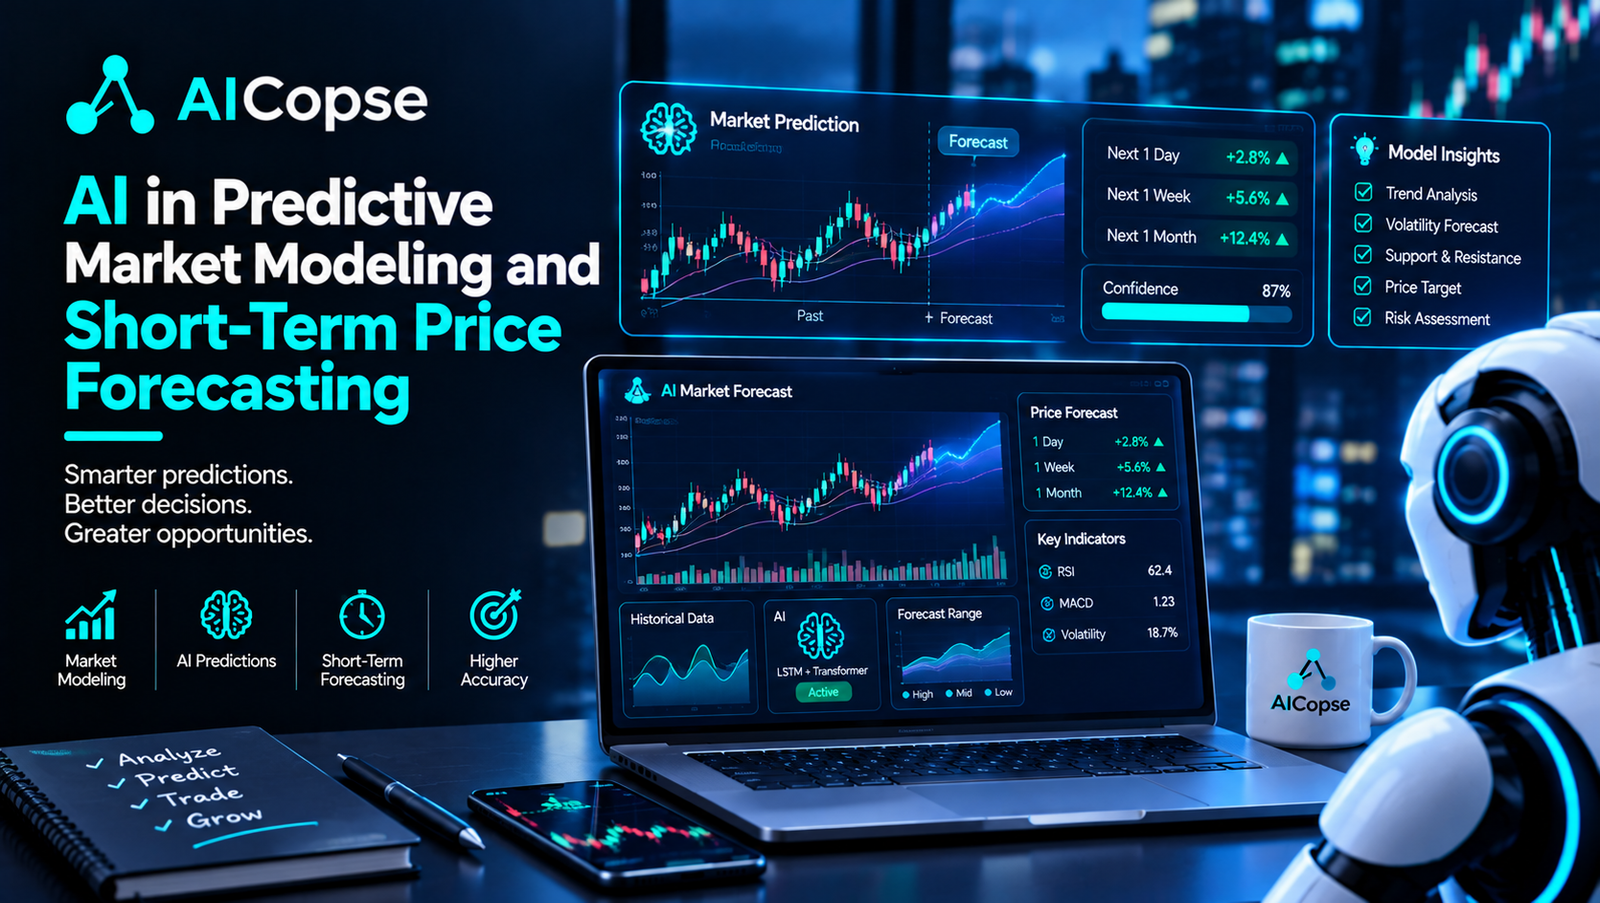
AICOPSE Research Report
AI in Predictive Market Modeling and Short-Term Price Forecasting
How artificial intelligence forecasts short-term market movements, combines price and sentiment data, adapts to changing market conditions, and turns predictions into measurable business decisions.
Market Forecasting
Short-Term Predictions
Research updated October 2026
Executive Summary
Predictive market modeling uses historical prices, trading activity, financial information, and other relevant signals to estimate what may happen next in a financial market. Artificial intelligence can help identify complex patterns in these inputs, but financial markets are noisy, competitive, and constantly changing. A model that performs well on historical data may become unreliable when investor behavior, volatility, liquidity, or economic conditions change.
Recent research explores Transformer architectures, Long Short-Term Memory networks, machine learning, financial language models, and hybrid systems that combine numerical forecasts with sentiment or rule-based reasoning. These methods offer useful research opportunities. However, forecast accuracy alone is not enough to establish commercial value. Businesses need leakage-safe testing, realistic transaction costs, uncertainty estimates, and ongoing monitoring before relying on predictions.
What this report covers
What short-term prediction means and why financial markets are difficult to model.
Traditional statistics, machine learning, LSTM, Transformers, and hybrid models.
Recent findings, practical lessons, and limitations of published results.
Data, testing, monitoring, startup opportunities, and future predictions.
What Is Predictive Market Modeling?
Predictive market modeling is the process of using available information to estimate future market behavior. A model may forecast the next five-minute return, estimate whether a stock is more likely to rise or fall during the next trading session, predict a volatility increase, or identify a possible change in the relationship between assets. These are different forecasting tasks, and each requires its own data, evaluation method, and definition of success.
Short-term price forecasting focuses on relatively near-term outcomes. Depending on the use case, the forecast horizon may range from milliseconds and seconds to minutes, hours, or the next trading day. A high-frequency trading team may study order-book changes over fractions of a second. A retail trading platform may estimate the direction of a stock over the next hour. An investment research team may predict next-day returns or short-term volatility. A model developed for one horizon should not automatically be used for another.
The central difficulty is that financial markets do not behave like a stable physical process. The relationships between prices, news, trading activity, and investor expectations can change. New information can arrive without warning, other market participants can respond to the same signals, and a previously useful pattern can weaken as it becomes widely known.
AI can help by learning nonlinear relationships across large datasets, but it cannot remove uncertainty from financial markets. Its purpose is to estimate probabilities and patterns more effectively, not to know future prices with certainty.
Price or return
Estimate a future price level, price change, or return over a defined period.
Direction
Estimate the probability of an upward move, downward move, or neutral outcome.
Volatility
Estimate the likely scale of future price movement and support risk management.
Market regime
Estimate whether market conditions resemble a trend, range, high-volatility period, or another defined state.
These forecast types can work together, but they should not be confused. Predicting that volatility will rise does not tell a system whether prices will rise or fall. Predicting direction does not establish how large a move will be. Forecasting a price level with a small numerical error may also be less useful than correctly estimating the probability of a meaningful return after costs.
Why Short-Term Market Forecasting Is Difficult
In liquid markets, prices react quickly to publicly available information. Many participants use similar data, technical indicators, economic releases, and machine-learning techniques. A pattern that appears predictive in historical data may be weak, temporary, or too expensive to trade once fees and slippage are included.
Short-term price changes are also affected by order flow, liquidity, market-maker activity, news surprises, and the behavior of other trading systems. A model trained on closing prices alone cannot directly observe every factor that affects intraday price formation. More detailed data may improve the model’s view of market activity, but it also increases data costs and engineering complexity.
This is why strong financial forecasting requires more than a large neural network. It needs a carefully defined prediction target, reliable data, a suitable baseline, realistic validation, and a process for monitoring performance after deployment.
For a broader look at the relationship between forecasting and trading systems, readers can explore AICOPSE’s guide to AI in Algorithmic Trading and Automated Strategy Execution. This report focuses on forecasting methods and the evidence required to evaluate them.
The Main AI Models Used for Short-Term Price Forecasting
No single model is best for every financial dataset. A useful model comparison begins with the prediction target, available data, forecast horizon, and operational requirements. Traditional statistical models remain valuable because they provide transparent baselines. Machine learning can model nonlinear relationships in engineered features. Deep learning can process complex sequences, while Transformer architectures can model relationships across different time steps and input variables.
Statistical models: ARIMA and GARCH
ARIMA models relationships in time-series values and their past errors. GARCH-family models are widely used to estimate changing volatility. These methods can provide interpretable baselines and may be useful when the data structure and target are suitable.
Best starting point: Forecasting baselines, return dynamics, and volatility estimates that can be compared with more complex models.
Machine learning: Random Forest and gradient boosting
Tree-based models learn relationships among features such as recent returns, volatility, volume, spreads, and technical indicators. They can be easier to train and maintain than large deep-learning systems, especially when the dataset consists of engineered features rather than very long raw sequences.
Best starting point: Tabular forecasting tasks, feature selection experiments, and reliable benchmarks for more advanced architectures.
LSTM and recurrent neural networks
Long Short-Term Memory networks were designed to learn sequential dependencies. They can process ordered data such as returns, volume, volatility, and sentiment signals across time. Their performance depends on sequence design, features, training choices, and how market conditions change.
Best starting point: Sequential prediction problems where relationships over a recent history are important.
Transformer models
Transformers use attention mechanisms to model relationships across time steps or input features. They can support complex forecasting tasks, but their computational needs, data requirements, and tuning burden can be substantial. They do not automatically outperform simpler methods.
Best starting point: Problems with meaningful temporal dependencies, multiple input signals, and enough data to justify a more complex architecture.
Hybrid and multimodal AI
Hybrid models combine different methods, such as numerical forecasting with financial sentiment, rule-based checks, or regime classification. They may capture useful information from multiple sources, but the extra components can introduce new errors and timing problems.
Best starting point: Tasks where news, financial text, market data, and structured risk rules provide complementary information.
A practical development team should compare these approaches on the same time periods, with the same forecast target and the same information availability. Comparing a Transformer that receives many data sources against an ARIMA model that receives only a price series does not reveal whether the architecture itself produced the improvement.
Six Research Studies and What They Actually Show
The studies below focus on recent market prediction research. Some investigate particular models, while others review a broader body of evidence. Their results are not directly interchangeable because they use different assets, data sources, forecast horizons, targets, and validation methods.
A Comparative Study of Transformer-Based and Classical Models for Financial Time-Series Forecasting
Published in the Journal of Risk and Financial Management, this study compares ARIMA, Random Forest, recurrent networks, LSTM, CNN, and Transformer models for one-day-ahead return forecasting. The experiment uses daily data from six U.S.-listed stocks: NVIDIA, Tesla, Super Micro Computer, Alphabet, PayPal, and Snap. The data period runs from 2014 to 2024, with price-related features, selected macroeconomic variables, and technical indicators.
The study uses walk-forward out-of-sample evaluation and time-series validation for model selection. This matters because a forecasting system must be tested on later data that was not used to fit the model. The authors find that model performance depends on the asset. ARIMA and Random Forest remain strong baselines, LSTM is competitive in some cases, and the Transformer is not consistently the best model for every stock.
Practical lesson
Do not assume that a complex model will outperform a simpler one. Select the model based on repeated out-of-sample results for the specific asset and forecast horizon.
Limitations: The study covers six U.S.-listed stocks and daily forecasting. Its findings should not be treated as proof that the same model ranking will hold for intraday prediction, other securities, or different market conditions. Forecasting one-day returns also differs from predicting the exact closing price.
Source: Read the full comparative study.
Quantformer: From Attention to Profit with a Quantitative Transformer Trading Strategy
Published in Expert Systems with Applications, Quantformer develops a Transformer-based architecture for building investment factors and forecasting future returns. The paper addresses the challenge of learning from numerical financial variables while capturing longer-range relationships. It draws on ideas associated with attention-based modeling and quantitative factor construction.
The distinction between a price forecast and a trading factor is important. A forecast estimates a future outcome, while a factor is a signal that can help rank securities or inform a portfolio decision. A factor may be useful even when it does not accurately predict the exact future price, provided it consistently helps distinguish better opportunities from weaker ones under an appropriate evaluation framework.
Practical lesson
A model should be evaluated according to its intended role. If it creates ranking signals, assess ranking quality and portfolio outcomes. If it forecasts returns, assess forecast errors, calibration, and whether the signals remain useful after trading costs.
Limitations: The paper’s proposed architecture is research evidence, not a guarantee of live trading profitability. Results depend on the assets, factor construction, backtesting process, and market conditions used in the experiment. A claimed improvement in a backtest must be checked for overfitting and realistic costs before commercial use.
Source: Read Quantformer.
Intelligent Financial Forecasting Using Transformers, Neuro-Symbolic AI, and Agent-Based Systems
This Scientific Reports study proposes a framework that combines Transformer-based forecasting with two decision layers: neuro-symbolic reasoning and an AI agent architecture that can incorporate external financial information. The numerical forecasting component predicts the closing price of India’s NIFTY Consumer Durables index. The later stages examine whether forecasts can be interpreted or used to inform decisions.
The design reflects a broader research direction. Rather than asking one model to do everything, developers can separate the task of estimating a market outcome from the task of deciding what that estimate means. A numerical model may predict a possible movement, while a rule-based component checks whether the signal conflicts with risk conditions or known constraints. An agent may retrieve additional information, but its conclusions still require verification.
Practical lesson
Separating forecasting from decision-making can improve system design and make it easier to audit how a prediction becomes an action.
Limitations: The experiment focuses on a specific Indian index, not a broad sample of U.S. markets. Its architecture is promising, but the result should not be generalized to all assets without independent testing. Adding an LLM or agent also introduces risks such as unsupported reasoning, delayed information, and inconsistent responses.
Source: Read the Scientific Reports paper.
Enhancing Stock Market Price Prediction Through FinGPT-Driven Sentiment Analysis and Hybrid Deep Learning
Published in Scientific Reports, this study investigates whether sentiment derived from financial text can add useful information to numerical market features. The framework uses FinGPT-based sentiment signals from Twitter alongside historical prices and technical indicators. It compares several neural architectures, including CNN, LSTM, attention-based LSTM, and a hybrid attention-based LSTM-CNN model.
The motivation is straightforward. Price and volume data describe what has happened in the market, while text can provide clues about how investors are interpreting company developments, economic news, or changing expectations. A financial language model can help extract a sentiment representation from text, and a numerical model can combine that representation with other features.
Practical lesson
Text sentiment should be tested as an additional feature, not assumed to be valuable simply because it comes from a finance-focused language model. Compare price-only, sentiment-only, and combined models to identify what the text actually contributes.
Limitations: The authors report improvements in their experiments across eight major NASDAQ and NYSE stocks, but the result depends on their data collection, labeling, and evaluation methods. Social media is noisy, can contain spam or coordinated activity, and may react to prices rather than predict them. The publication does not establish that the approach will generate profits in live trading.
Source: Read the full study.
LiT: Limit Order Book Transformer
This paper, published in Frontiers in Artificial Intelligence, investigates short-term market movement prediction using high-frequency limit order book data. Its proposed LiT architecture uses structured patches and Transformer attention to learn spatial and temporal patterns in order-book observations. These patterns can include relationships between bid and ask levels and changes over successive observations.
Order-book forecasting differs from predicting tomorrow’s closing price from daily candles. At very short horizons, the balance of available buying and selling liquidity, changes in the order book, and the timing of trade events can carry relevant information. A model may try to predict the next price movement rather than the precise numerical price at the end of a trading day.
The authors report that LiT outperformed traditional machine-learning and other deep-learning baselines across their tested datasets and horizons. They also examine fine-tuning under distribution shifts, which is important because high-frequency market patterns can change between periods or instruments.
Practical lesson
When forecasting depends on the structure of market microdata, architecture and data representation matter. Teams should test whether a model’s gains survive across different periods and assets, rather than relying on a single benchmark.
Limitations: High-frequency prediction results do not automatically apply to daily or hourly trading. The economic value of a correct prediction depends on the size of the move, latency, execution quality, fees, and how quickly the signal decays.
Source: Read the LiT research paper.
Artificial Intelligence Methods for Financial Market Prediction: A Systematic Review
Published in Computers and Electrical Engineering, this systematic review examines financial prediction research from 2013 through 2025. It covers traditional statistical methods, machine learning, recurrent networks, LSTM, CNN, Transformers, generative approaches, and reinforcement learning. It also discusses the geographic concentration of datasets, challenges in non-stationary markets, interpretability, and the difference between predictive accuracy and practical trading profitability.
A systematic review is useful because it looks across many studies rather than testing one architecture on one dataset. The review reports that LSTM models have been common in the literature, while Transformer approaches are emerging as alternatives for modeling longer-range relationships. It highlights a persistent gap between improved statistical predictions and the ability to turn those predictions into practical profit.
Practical lesson
A good forecasting program must evaluate both statistical quality and economic usefulness. Research teams should document model assumptions, baseline strength, data coverage, validation design, and whether trading costs are included.
Limitations: A review summarizes the evidence available within its search and selection process. It does not prove that every method performs equally well across all financial markets, and its conclusions are limited by differences in the underlying studies.
Source: Read the systematic review.
What these six studies collectively suggest
- Model performance depends on the asset, data frequency, forecast target, and evaluation period.
- Transformers and hybrid systems are promising research directions, but traditional models remain important baselines.
- Financial sentiment can add information, but its value should be tested against price-only models and verified for timing and reliability.
- High-frequency order-book prediction and daily return forecasting are different tasks and need different testing designs.
- A better statistical forecast does not automatically produce better trading results.
- Robust evaluation should include unseen periods, changing market conditions, uncertainty, and realistic transaction costs.
How to Choose the Right Forecast Target
Many forecasting projects begin with the wrong question: “Which AI model predicts stock prices best?” A better question is: “What decision must this forecast improve?” A model designed to estimate next-hour direction may not be suitable for estimating volatility or ranking securities. The target should reflect the intended business use.
For directional trading signals
Estimate the probability of an upward or downward move over a defined horizon. Evaluate precision, recall where relevant, calibration, and the economic value of acting on the signal after costs.
For risk management
Forecast volatility or the probability of a large adverse move. Evaluate how well the model captures changing risk and whether it provides useful warnings during stressed conditions.
For portfolio construction
Forecast relative returns or rank assets. Test whether the ranking remains useful across time and whether a portfolio built from the predictions survives turnover, concentration, and transaction-cost constraints.
For execution systems
Estimate short-term price pressure, liquidity, or the chance that a price move will occur before an order can be filled. Combine predictions with execution rules and independent risk limits.
For example, a company building an analytics dashboard for investment managers may not need to predict the exact future price. It may be more useful to estimate a range of possible returns, highlight unusually high uncertainty, and show how the current market differs from the conditions in which the model was trained.
Data Sources and Feature Engineering
Financial prediction systems may combine several categories of information. The appropriate mix depends on the target and the time horizon. Data must be timestamped and aligned so the model only sees information that was available at the time of the forecast.
Price and volume
Returns, price ranges, trading volume, gaps, moving averages, and volatility estimates derived from historical market observations.
Market microstructure
Bid-ask spread, order-book depth, order-flow imbalance, trade intensity, and liquidity changes where suitable data is available.
Economic and company data
Economic releases, interest-rate information, earnings dates, financial statements, and corporate events, using only data available at the forecast time.
News and sentiment
Time-stamped headlines, company announcements, financial text, and sentiment features generated by a carefully tested language model.
Feature engineering requires care. A moving average calculated with future observations is leakage. A sentiment score based on an article published after the forecast time is leakage. A macroeconomic series downloaded in its revised form may include information that was not available to investors when the original release was published. These mistakes can create a backtest that looks impressive but cannot be reproduced in real time.
For U.S. equity research, developers should consider trading calendars, exchange sessions, earnings announcements, market holidays, and the difference between regular-session and after-hours data. The model’s training data should represent the same type of environment in which it will be used. A system trained only on quiet periods may struggle during earnings announcements or sudden macroeconomic shocks.
Data licensing also matters for commercial products. Teams should verify whether a feed permits storage, model training, derived analytics, redistribution, and customer access. A source being accessible online does not automatically mean every commercial use is permitted.
A Practical AI Market Forecasting Workflow
Developers and startups should build a reproducible process that links data, model training, testing, and monitoring. The objective is not merely to generate predictions, but to establish whether the predictions are dependable enough for the intended use.
Define the decision and forecast horizon
Specify the asset universe, target variable, prediction horizon, refresh frequency, and how a forecast will be used. Avoid combining unrelated prediction goals into one vague accuracy metric.
Build a time-aware dataset
Align prices, trades, economic data, and news to their actual availability. Check for missing values, duplicates, revised releases, outliers, and incorrect timestamps.
Create simple baselines
Compare the proposed model with sensible alternatives such as a no-change forecast, historical average, ARIMA, or Random Forest. A model should justify its complexity through measured improvement.
Train and validate chronologically
Use earlier periods for training and later periods for validation. Reserve a final unseen test period and repeat the process through walk-forward evaluation where practical.
Evaluate statistical and economic value
Measure forecast errors, direction metrics, calibration, and stability. If the model informs trading, test the resulting strategy after realistic fees, spread, slippage, turnover, and execution assumptions.
Deploy in observation mode
Generate predictions without automatically acting on them. Compare forecasts with subsequent outcomes and record errors, delays, missing data, and model confidence.
Monitor and retrain responsibly
Track model drift, changes in error, data quality, and performance by market condition. Retraining should follow documented criteria and pass the same validation process as the original model.
How to Evaluate a Forecast Properly
Forecast evaluation should match the model’s intended task. For numerical predictions, teams can use mean absolute error, root mean squared error, and other suitable measures. For directional forecasts, they may examine balanced accuracy, precision, recall, and the quality of probability estimates. For trading signals, they should also evaluate portfolio outcomes and the costs required to act on the signal.
Forecast error
How far are numerical predictions from actual outcomes? Use metrics suited to the target and avoid interpreting price-level error without considering the scale of the asset.
Probability calibration
When a model assigns a 60% chance to an event, do similar predictions occur at roughly that rate over a sufficiently large and relevant sample?
Economic usefulness
Does the signal improve a defined decision after trading costs, turnover, position constraints, and realistic execution are included?
Stability
Does performance remain acceptable across different periods, instruments, volatility levels, and market regimes?
A common mistake is to select a model based on the best result from dozens or hundreds of experiments. The more models, features, thresholds, and time periods a team tests, the greater the risk that the best result reflects chance. A final evaluation should be performed on data that was not used to choose the model or tune its parameters.
Another mistake is to shuffle financial time-series observations randomly into training and test sets. Random splits can place highly related observations from adjacent periods in both sets, giving an unrealistically favorable result. Chronological validation is usually more appropriate for a system that must forecast future events using past information.
Finally, a directional accuracy score is not a profit guarantee. A model may correctly forecast many small price changes but miss a few large adverse moves. It may also identify a movement only after the opportunity has passed. Performance must be evaluated against the real purpose of the system.
Competitor and Content Landscape
Useful information about predictive market modeling is spread across academic journals, market-data providers, quant platforms, and financial education websites. Each serves a different purpose. Academic papers provide technical methods and experiments. Quant platforms help developers implement and backtest strategies. Financial education websites explain market concepts to a broad audience. Data providers document feeds, coverage, and analytical tools.
Academic research and systematic reviews
Sources such as Frontiers in Artificial Intelligence, Scientific Reports, and research journals provide model designs, datasets, evaluation methods, and limitations.
Their strength is technical depth. Their limitation for a general business reader is that findings can be difficult to translate into product decisions, especially when papers use different assets, forecast horizons, and performance metrics.
Quant development platforms
QuantConnect documentation covers algorithm development, data, backtesting, and trading models. It helps bridge the gap between a forecasting concept and a testable strategy.
Its value is practical implementation guidance. Developers still need to check whether the data, fill assumptions, and backtesting environment reflect their intended real-world use.
Market-data and analytics providers
LSEG Data and Analytics and other market-data providers offer tools and data that may support quantitative research and market analysis.
These resources are important for understanding data coverage, timeliness, and infrastructure. Access costs, licensing conditions, and suitability differ across products.
Financial education and market commentary
General finance websites can explain market indicators and trading concepts clearly, but their articles may not provide enough experimental detail to establish whether a specific AI architecture is genuinely better than a baseline.
The opportunity for AICOPSE is to connect the research to decisions that developers, startups, and businesses need to make. Instead of simply listing AI models, this report explains what each model is designed to predict, how it should be tested, what evidence the research provides, and why an accurate forecast may still fail to create value.
This is a qualitative content landscape assessment, not a claim that every competing page has been audited or that a particular Google ranking is guaranteed. Search visibility depends on content quality, technical SEO, competition, site authority, user intent, and other factors. The report’s strongest differentiation is its combination of recent studies, limitations, practical implementation, and business-focused recommendations.
For related reading, AICOPSE has articles on AI in Predictive Financial Modeling and Market Forecasting, AI in Algorithmic Trading and Automated Strategy Execution, and AI in Stock Market Trading Strategy Development. These links connect forecasting to the broader workflow of strategy design, testing, and execution.
Current Developments and Their Significance
Recent research suggests that financial forecasting is moving toward systems that combine multiple kinds of information rather than relying on one price series alone. Transformer architectures, financial language models, and hybrid approaches are receiving attention. At the same time, regulators and market institutions are considering how AI affects the public-market information environment and market integrity.
Transformer and hybrid forecasting research is expanding
Recent papers examine Transformers for numerical time-series forecasting and combine market data with sentiment or rule-based reasoning. This indicates growing interest in models that can use multiple inputs and separate prediction from downstream decision-making.
Business implication: Teams should test whether each added input or model component provides incremental value. A larger system is not necessarily better if the additional data is noisy, arrives late, or adds operational complexity without improving results.
Sources: Quantformer and FinGPT-driven sentiment research.
SEC Investor Advisory Committee discussion of AI and public markets
The SEC announced a September 10, 2026, Investor Advisory Committee meeting that included panels on AI technologies in the public-markets information ecosystem and Regulation National Market System rules. This is relevant to forecasting because market information quality, access, and market structure can influence how models are trained and used.
The meeting announcement does not mean a new forecasting rule was adopted. It shows that AI and the information environment are subjects of regulatory discussion. Businesses should monitor official developments rather than treating every meeting or proposal as a binding requirement.
Source: SEC meeting announcement.
AI capabilities increase the importance of monitoring and governance
Market surveillance and oversight teams are examining how AI can support detection, investigation, and analysis as trading environments become more data-intensive. These developments matter to forecasting businesses because the same technologies that identify useful patterns can also produce false signals, amplify errors, or make decisions difficult to explain.
Business implication: Build monitoring and auditability into the system from the start. Record model versions, data timestamps, forecast outputs, confidence estimates, and any action taken as a result. Governance should be part of the architecture rather than a final document created after deployment.
Further reading: LSEG’s 2026 discussion of market surveillance.
Business Opportunities for Startups and Financial Technology Firms
A startup does not need to build a fully autonomous trading system to create value from predictive market modeling. Some of the most practical opportunities are products that help users understand uncertainty, compare forecasts, monitor changing market conditions, or evaluate risk. These products can be useful to financial firms without promising guaranteed returns.
Forecast analytics platform
A dashboard that compares model predictions with actual outcomes, tracks errors by asset and time horizon, and highlights where forecast reliability is declining.
Financial sentiment API
A service that turns time-stamped financial news into structured sentiment or event signals, with source tracking and clear limitations around coverage and latency.
Volatility and risk forecasts
A risk tool that estimates changing volatility, identifies unusual market conditions, and helps investment teams adjust exposure or investigate risk.
Model testing and monitoring
A platform for walk-forward backtesting, leakage checks, drift monitoring, benchmark comparison, and reporting that makes model evaluation more reproducible.
Before building, founders should interview potential users to understand what decision the forecast will improve. A hedge fund, broker, financial adviser, and retail investor have different requirements. They may need different data frequencies, audit trails, risk controls, and integration methods. A product that works well as a research dashboard may require substantial additional work before it can safely support live trading.
Startups should also avoid marketing a model using unqualified claims such as guaranteed accuracy or consistent profits. Explain what the model predicts, which market and period were tested, what baseline was used, and whether the results include realistic costs. Transparent claims are more useful to serious customers than a single impressive backtest chart.
Risks, Governance, and Responsible Deployment
Predictive models can influence financial decisions even when they are not allowed to execute trades directly. Poor forecasts may lead to unnecessary portfolio turnover, delayed decisions, excessive confidence, or inappropriate risk-taking. Businesses should treat the model as one source of evidence within a wider decision process.
For U.S. financial products, legal and compliance teams should determine which requirements apply to the actual business model. An internal research tool, an adviser-facing analytics product, a broker-dealer system, and an automated trading service may face different obligations. Businesses serving customers in other countries should also review local rules and data requirements.
Future Predictions for 2027 to 2030
The following outlook is based on current research directions and industry developments. It is not a claim that these outcomes are certain. Adoption will depend on whether the technology provides measurable value, whether the required data is available, and whether businesses can manage the risks of automated decision support.
Greater focus on model reliability
Businesses are likely to place more emphasis on reproducible tests, model monitoring, and the ability to explain forecast errors. Better governance can become a competitive advantage for platforms selling to professional financial users.
More multimodal forecasting experiments
Models may increasingly combine price data, market microstructure, financial news, and economic indicators. The main challenge will be proving that each new data source improves forecasts after accounting for timing, noise, and operational cost.
More regime-aware systems
Forecasting systems may increasingly combine return estimates with volatility and regime detection, adjusting their confidence or restricting use when the current market differs sharply from training data.
Prediction and decision systems become more clearly separated
More mature products may distinguish the forecast, uncertainty estimate, risk checks, and final action. This separation can make it easier to audit decisions and prevent a model output from being treated as an instruction without review.
The most important future development may not be a single new model architecture. It may be the growing expectation that forecasting products prove their reliability under changing conditions. Financial firms need models that can communicate uncertainty, demonstrate value against fair baselines, and identify when their own predictions should not be trusted.
Expert Recommendations for Developers and Businesses
- Define the use case before choosing the model. Decide whether the system forecasts direction, returns, volatility, or relative performance.
- Keep traditional baselines. Compare AI with simple statistical and machine-learning models before adopting more complex architectures.
- Use point-in-time data. Make sure prices, news, economic releases, and features reflect only the information available at forecast time.
- Use walk-forward evaluation. Test on later periods and repeat across multiple market conditions to understand how performance changes.
- Measure uncertainty. Show probability estimates or forecast ranges where appropriate, and assess whether confidence scores are calibrated.
- Test economic value separately. If the forecast informs trading, evaluate turnover, transaction costs, execution, and risk rather than relying only on prediction accuracy.
- Track the contribution of each data source. Compare price-only, sentiment-only, and combined models to verify whether additional data actually helps.
- Monitor live predictions. Track data quality, forecast errors, drift, and failure cases. Establish clear criteria for recalibration or disabling a model.
- Communicate limitations honestly. State which assets, time periods, and horizons were tested. Do not present historical performance as a guarantee of future results.
Frequently Asked Questions
What is AI in predictive market modeling?
It is the use of machine learning and related AI methods to estimate future financial outcomes from historical market data and other relevant information. Depending on the task, a model may forecast returns, direction, volatility, or changing market conditions.
Can AI predict short-term stock prices accurately?
Some models can identify useful patterns in specific datasets and forecast horizons, but accuracy varies by asset and market condition. Financial markets are noisy and change over time. A forecast should be evaluated on unseen data and should not be treated as a guarantee.
Are Transformers better than LSTM and Random Forest?
Not in every case. Transformers can model complex relationships, LSTM networks are designed for sequential information, and Random Forest can perform well on engineered features. Recent comparative research shows that the best model depends on the asset, target, data, and validation method.
Can financial sentiment improve price forecasting?
It may add useful information when financial text contains signals not already reflected in price data. Its contribution must be tested carefully because social media can be noisy, duplicated, manipulated, or published after the market has already reacted.
What is the biggest mistake in AI market forecasting?
A major mistake is evaluating a model on data that leaks future information or selecting it using the same period later presented as an independent test. Another is assuming that forecast accuracy automatically leads to profitable trading.
What data does a short-term forecasting model need?
A basic model may use historical prices, returns, and volume. More advanced systems may add order-book information, volatility, news, sentiment, and economic data. The correct inputs depend on the forecast horizon and the decision the model is intended to support.
Can a startup build a financial forecasting product?
Yes. A startup can begin with a focused product such as model monitoring, forecast analytics, volatility estimation, or financial sentiment data. A live trading product requires additional work around execution, data licensing, operational controls, and applicable regulations.
How often should a forecasting model be retrained?
There is no universal retraining schedule. It depends on the data frequency, model stability, market changes, and the cost of retraining. Teams should monitor forecast quality and data drift, then retrain according to documented criteria and repeat the required validation checks.
Conclusion: Better Forecasting Requires Better Evidence
AI is expanding the methods available for predictive market modeling and short-term price forecasting. Statistical models, tree-based machine learning, LSTM networks, Transformers, financial sentiment models, and hybrid systems each offer different ways to analyze market information. Recent research demonstrates active development in these areas, but it does not establish one universally superior model.
The practical challenge is to turn a statistical pattern into a dependable forecast. That requires accurate data, a clearly defined target, time-aware validation, strong baselines, uncertainty estimates, and ongoing monitoring. If predictions inform trading, the evaluation must also account for transaction costs, execution, turnover, and risk.
For developers and startups, the strongest starting point is a specific problem with measurable value. For financial businesses, the priority should be evidence that the model remains useful across changing conditions. The most successful systems are likely to be those that combine capable forecasting with disciplined evaluation, clear limitations, and responsible decision-making.
Explore More from AICOPSE
Continue exploring AI applications across forecasting, trading strategy development, and automated execution.
Sources and Further Reading
The following research papers and official resources support the report. Findings should be interpreted within the specific markets, datasets, prediction horizons, and methods used in each publication.
Journal of Risk and Financial Management, March 2026
https://www.mdpi.com/1911-8074/19/3/203
Expert Systems with Applications, June 2026
https://www.sciencedirect.com/science/article/pii/S095741742600480X
Scientific Reports, May 2026
https://www.nature.com/articles/s41598-026-49558-0
Scientific Reports, June 2026
https://www.nature.com/articles/s41598-026-58717-2
Frontiers in Artificial Intelligence, October 2025
https://www.frontiersin.org/journals/artificial-intelligence/articles/10.3389/frai.2025.1616485/full
Computers and Electrical Engineering, June 2026
https://www.sciencedirect.com/science/article/abs/pii/S0045790626001825
U.S. Securities and Exchange Commission, September 2026
https://www.sec.gov/newsroom/press-releases/2026-84-sec-investor-advisory-committee-host-sept-10-meeting
LSEG Insights, March 2026
https://www.lseg.com/en/insights/fx/market-surveillance-in-2026-a-q-and-a-with-lseg-experts-on-regulation-data-and-technology
Algorithm development, data, and backtesting
https://www.quantconnect.com/docs/v2
Disclaimer
This report is for educational and informational purposes only. It is not investment advice, a recommendation to buy or sell any financial instrument, or a guarantee of future results. AI forecasting systems can produce inaccurate predictions and financial losses. Research findings depend on the data, assets, forecast horizons, and evaluation methods used. Businesses should obtain appropriate legal, compliance, data-licensing, and risk-management advice before using forecasts in financial decisions or automated trading.

Leave a Reply